COMPLIANCE WITH GLOBAL STANDARDS: BASEL, COSO, ISO, NIST, & SARBOX
- By Admin
- March 18, 2015
- Comments Off on COMPLIANCE WITH GLOBAL STANDARDS: BASEL, COSO, ISO, NIST, & SARBOX
The Enterprise Risk Management (ERM) methods deployed by any organization should at least consider compliance with global standards if not exactly mirroring COSO (Committee of Sponsoring Organizations of the Treadway Commission, with respect to their organizing committees at AAA, AICPA, FEI, IMA, and IIA), International Standards ISO 31000:2009, the U.S. Sarbanes–Oxley Act, the Basel III requirements for Operational Risk (from the Basel Committee through the Bank of International Settlements), and NIST 800‐37. The parallels and applications of ROV methodologies closely mirror these regulatory and international standards and, at times, exceed these standards. Figures 1‐10 illustrate some examples of compliance with ISO 31000:2009, and Figures 11‐20 show compliance with Basel II and Basel III requirements. These figures and the summary lists below assume that the reader is already familiar with the IRM methodology employed by Real Options Valuation, Inc.
Compliance with International Standards Organization ISO 31000:2009
The following provides a quick summary pertaining to ISO compliance:
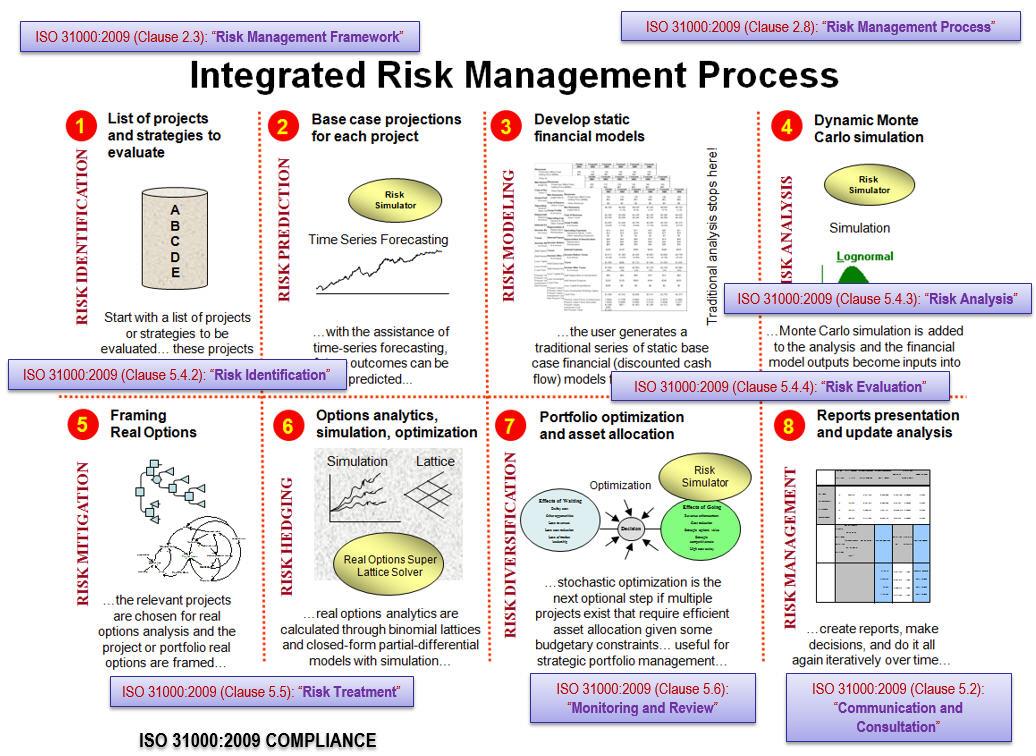
- The IRM methodology we employ is in line with ISO 31000:2009 Clauses 2.3 and 2.8 requiring a risk management process (Figure 1), as well as Clause 5 (5.4.2 requiring risk identification where we use Tornado analysis and scenario analysis; 5.4.3. requiring quantitative risk analysis where we apply Monte Carlo risk simulations; 5.4.4 where existing Excel‐based evaluation models are used and overlaid with IRM methodologies such as simulations; etc.). See Modeling Risk, 3rd Edition’s Chapter 1 for details on the IRM methodology.
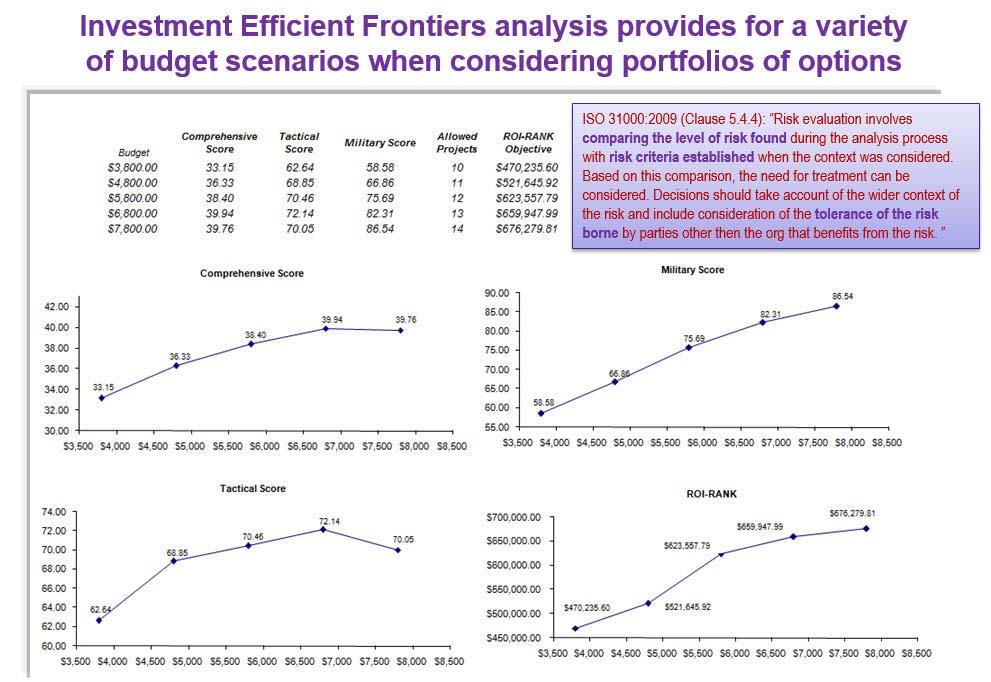
- ISO 31000:2009 Clause 5.4.4 looks at the risk tolerance levels and comparing various risk levels in a portfolio optimization and efficient frontier analysis employed in our IRM methodology (Figure 2). See Modeling Risk, 3rd Edition’s Chapters 10 and 11 for optimization and efficient frontier modeling.
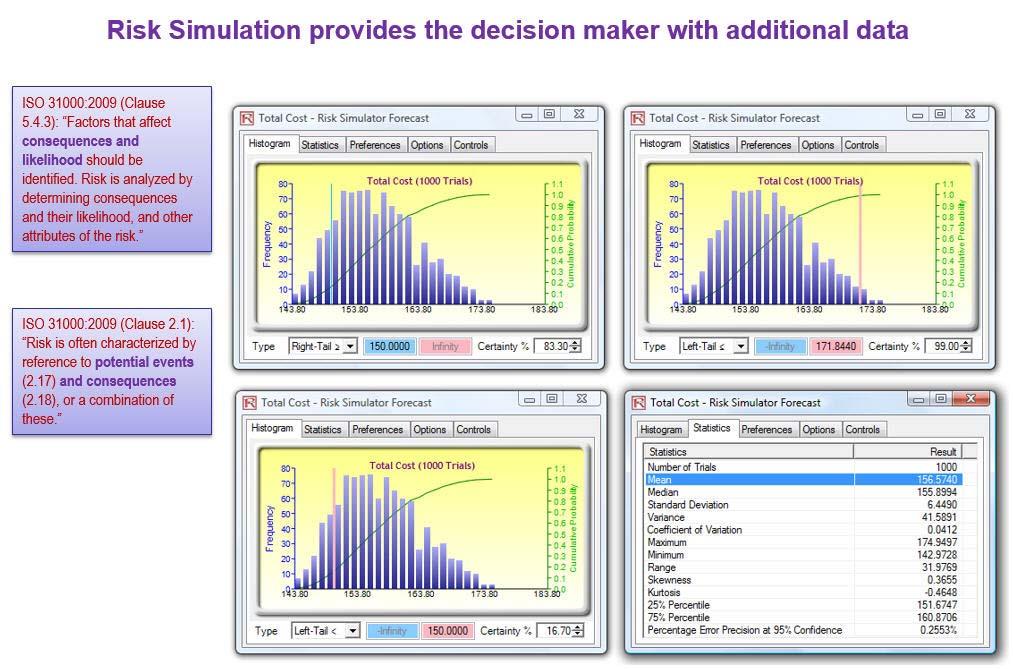
- Figure 3 shows quantified consequences and the likelihoods (probabilities and confidence levels) of potential events that can occur using simulations, as required in ISO 31000:2009 Clauses 2.1 and 5.4.3.
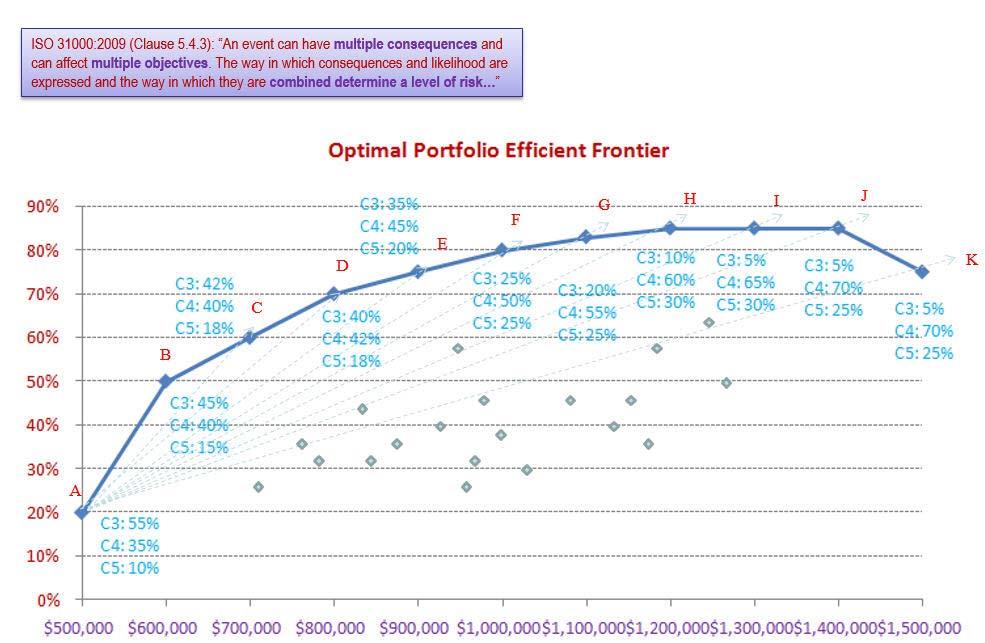
- ISO 31000:2009 Clause 5.4.3 requires viewing the analysis from various stakeholders, multiple consequences, and multiple objectives to develop a combined level of risk. This perspective is achieved through a multicriteria optimization and efficient frontier analysis (Figure 4) in the IRM process. See Modeling Risk, 3rd Edition’s Chapters 10 and 11 for optimization and efficient frontier modeling.
- ISO 31000:2009 Clause 3F requires that historical data and experience as well as stakeholder feedback and observation coupled with expert judgment be used to forecast future risk events. The IRM process employs a family of 16 forecasting methods (Figure 5 shows an example of the ARIMA model) coupled with risk simulations with high fidelity to determine the best goodness‐of‐fit when historical data exists, or using subject matter expert estimates and stakeholder assumptions, we can apply the Delphi method and custom distribution to run risk simulations on the forecasts. See Modeling Risk, 3rd Edition’s Chapters 8 and 9 for forecast methods and analytical details.
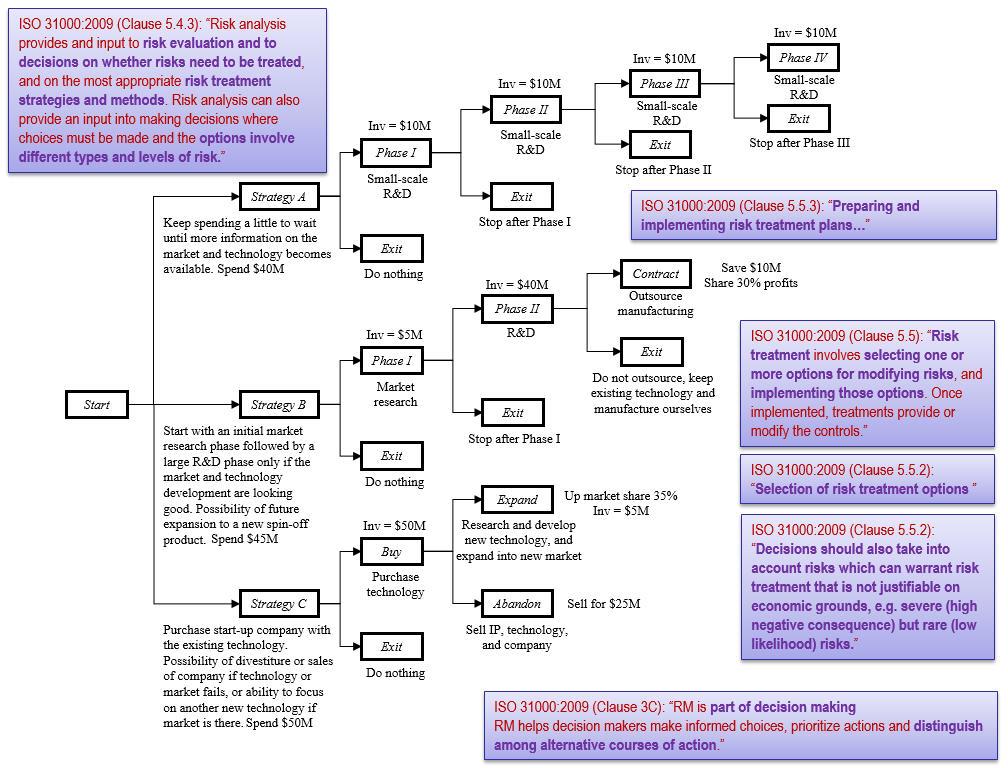
- ISO 31000:2009 Clauses 3C, 5.4.3, 5.5, and 5.5.2 require risk evaluations on risk treatments, options to execute when there are different types of risks, and selecting and implementing various risk treatment strategic options that are not solely reliant on economics. The IRM’s strategic real options methodology allows users to model multiple path‐independent and path‐dependent implementation strategies or alternate courses of action that are generated to mitigate downside risks and take advantage of upside potentials (Figure 6). See Modeling Risk, 3rd Edition’s Chapters 12 and 13 for details on real options analysis modeling techniques.
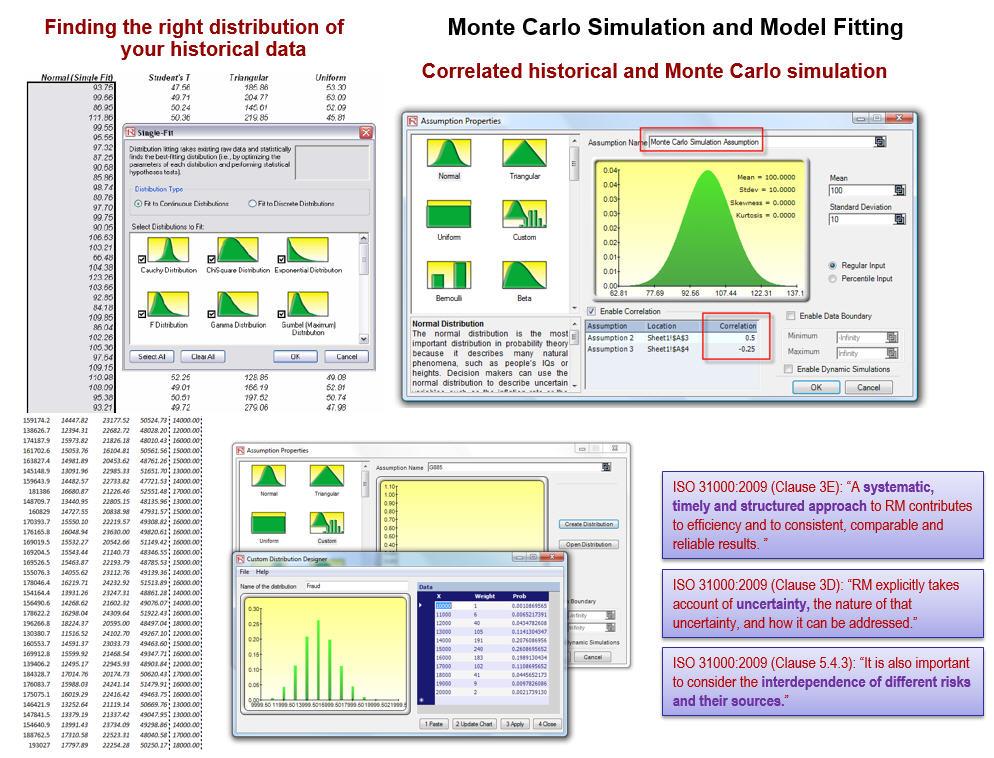
- Figure 7 illustrates how ISO 31000:2009 Clauses 3D, 3E, and 5.4.3 are satisfied using the IRM
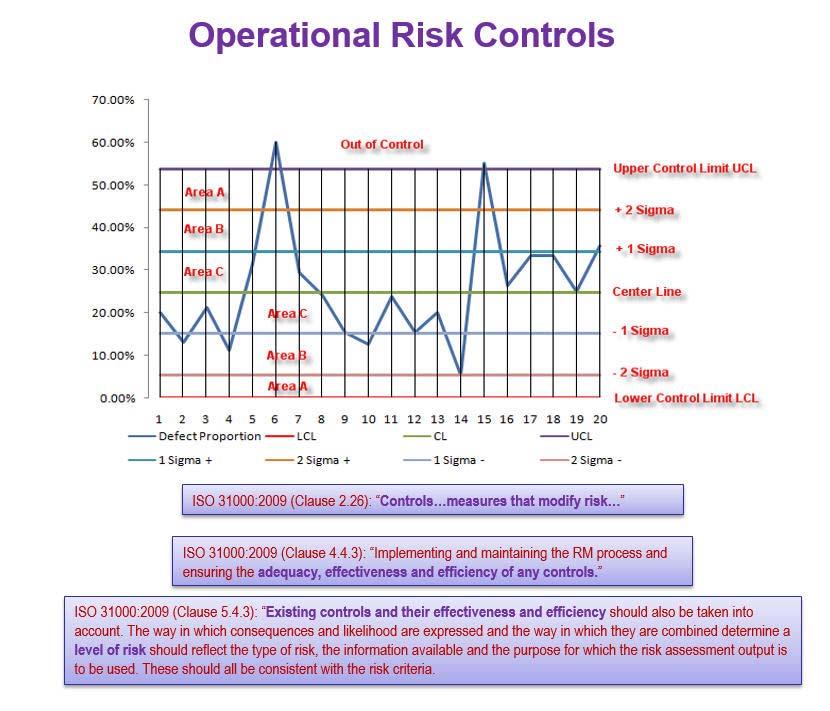
process of probability distribution fitting of uncertain variables and how their interdependencies (correlations) are executed. - Risk controls are required in ISO 31000:2009 Clauses 2.26, 4.43, and 5.4.3 (Figure 8). The control charts and Risk Effectiveness calculations in PEAT ERM help decision makers identify if a particular risk mitigation strategy and response that was enacted had sufficiently and statistically significantly affected the outcomes of future risk states.
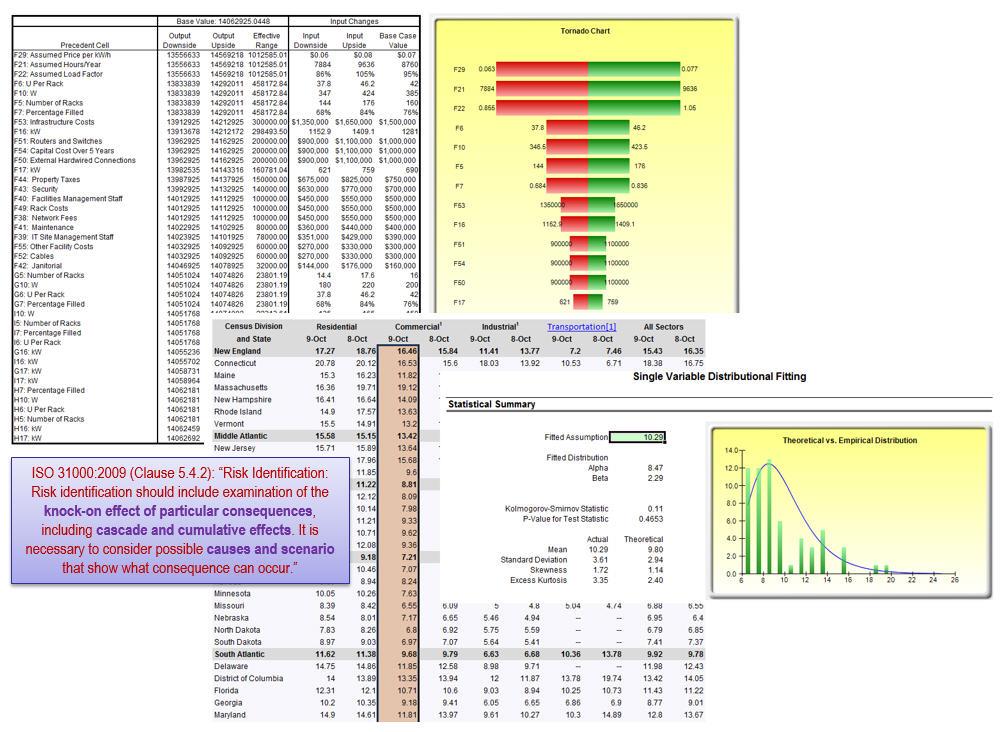
- Scenarios, cascading, and cumulative effects (consequences) are also the focus of ISO 31000:2009 Clause 5.4.2. The IRM method employs Tornado analysis, scenario analysis, dynamic sensitivity analysis, and risk simulations (Figure 9) to identify which input(s) have the highest impact on the organization’s risks and model their impacts on the total risks of the organization.
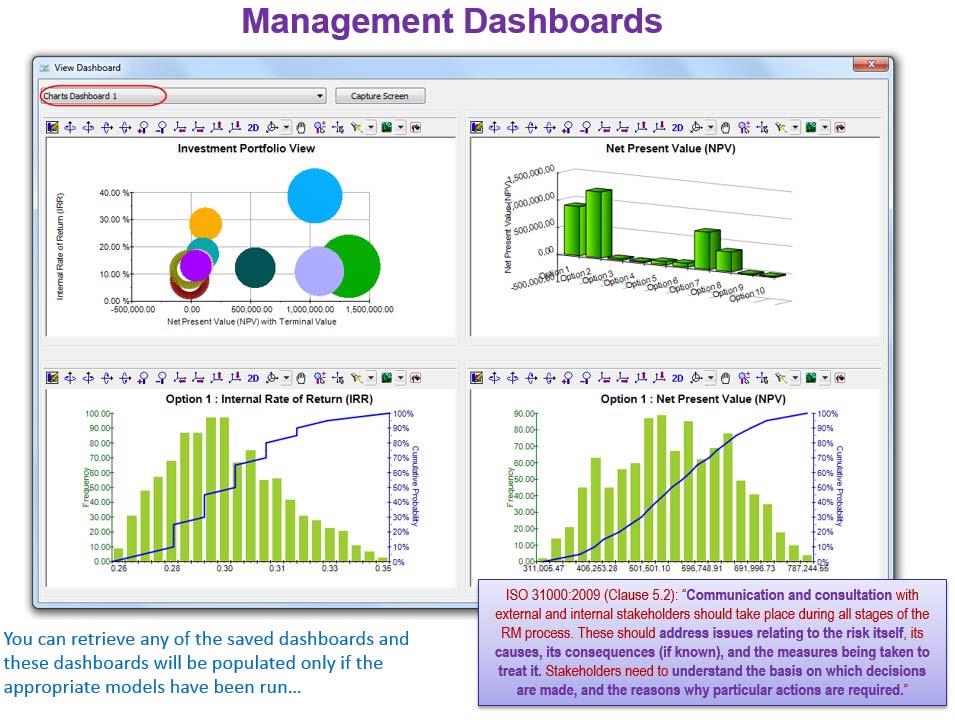
- ISO 31000:2009 Clause 5.2 requires proper communication of risk exposures and consequences, and an understanding of the basis and reasons of each risk. The PEAT ERM Risk Dashboards provide details and insights for a better understanding of the issues governing each of the risk issues in an organization (Figure 10).

Compliance with Basel II and Basel III Regulatory Requirements
The following provides a summary of Basel II and Basel III compliance when using the IRM methodology:
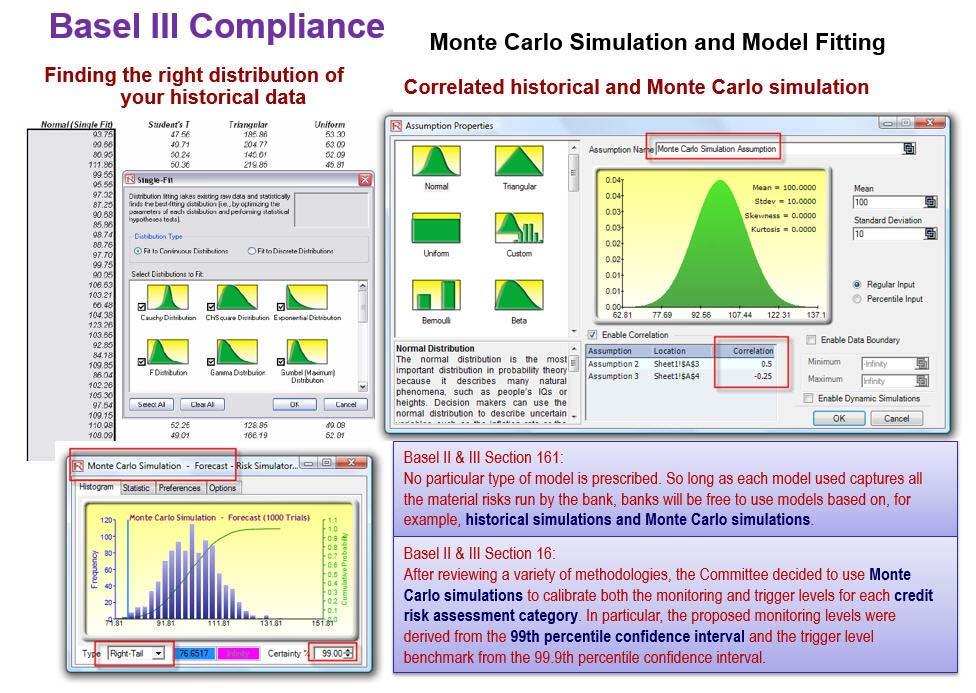
- Figure 11 shows Monte Carlo risk simulations applied to determine confidence levels, percentiles,
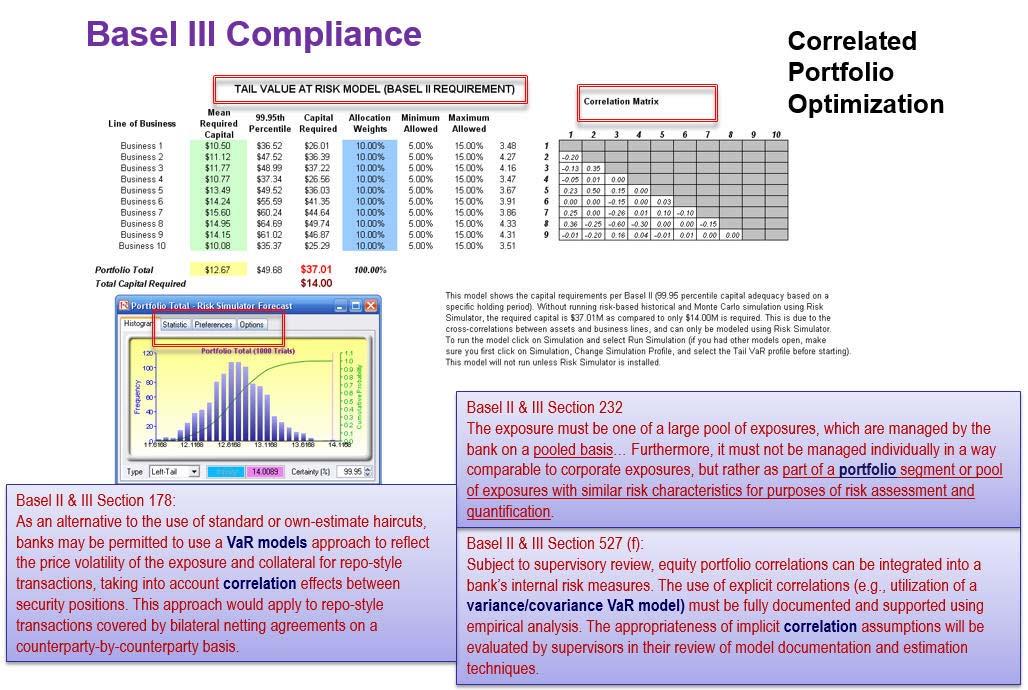
and probabilities of occurrence using historically fitted data or forecast expectations. These methods are in line with Basel II and Basel III requirements Sections 16 and 161 concerning the use of historical simulations, Monte Carlo simulations, and 99th percentile confidence intervals. See Modeling Risk, 3rd Edition’s Chapters 5 and 6 for details on simulations and data fitting techniques. - Figure 12 shows a correlated simulation of a portfolio of assets and liabilities, where asset returns
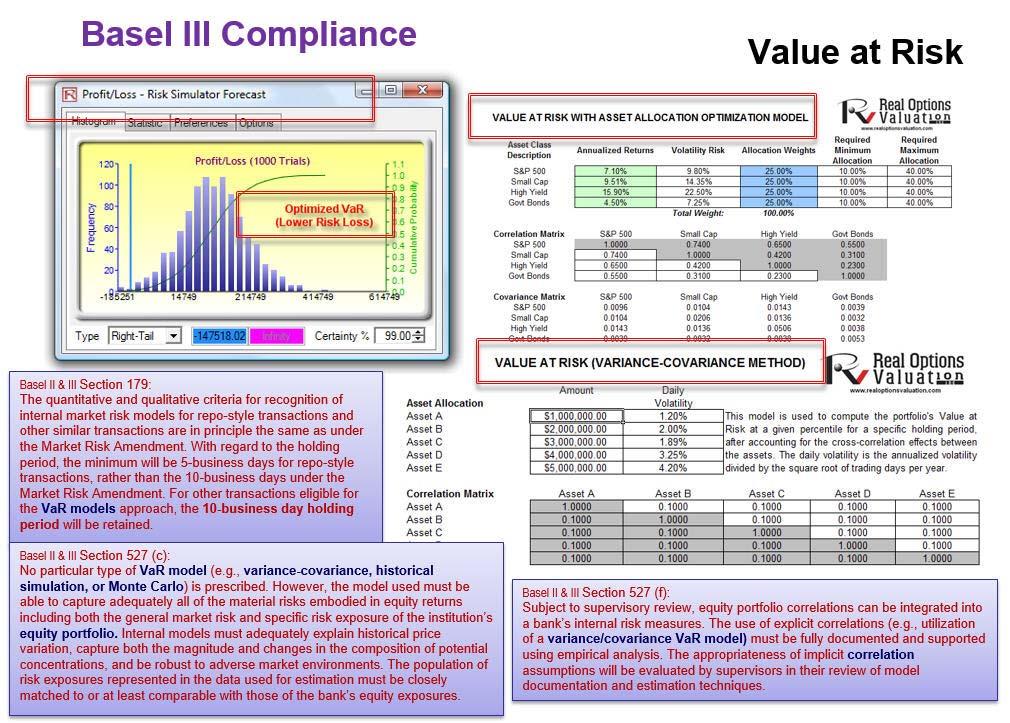
are correlated against one another in a portfolio and optimization routines were run on the simulated results. These processes provide compliance with Basel II and Basel III requirements Sections 178, 232, and 527(f) involving correlations, Value at Risk or VaR models, portfolios of segments, and pooled exposures (assets and liabilities). See Modeling Risk, 3rd Edition’s Chapter 5 for correlated simulations and Chapter 7’s case study on Basel II and Basel III Credit, Market, Operational, and Liquidity Risks with Asset Liability Management for details on how VaR models are computed based on historical simulation results. - Figure 13 shows Value at Risk percentile and confidence calculations using structural models and
simulation results that are in line with Basel II and Basel III requirements Sections 179, 527(c), and
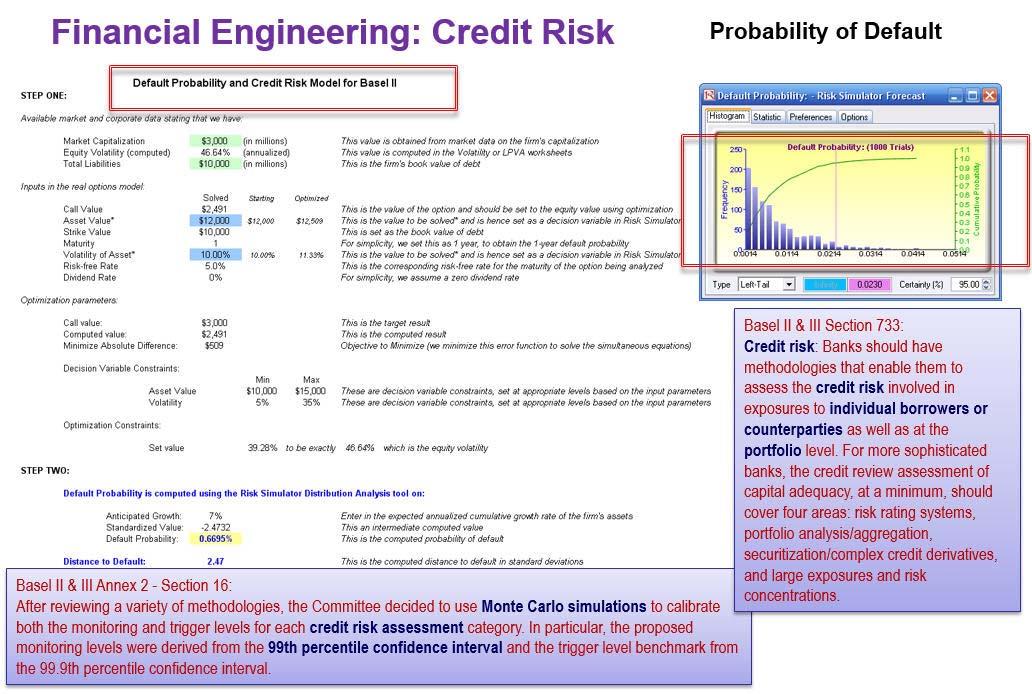
527(f). As noted above, see Modeling Risk, 3rd Edition’s Chapter 7’s case study for details on how VaR models are computed based on historical simulation results. - Figure 14 shows the computations of probability of default (PD) as required in the Basel Accords,
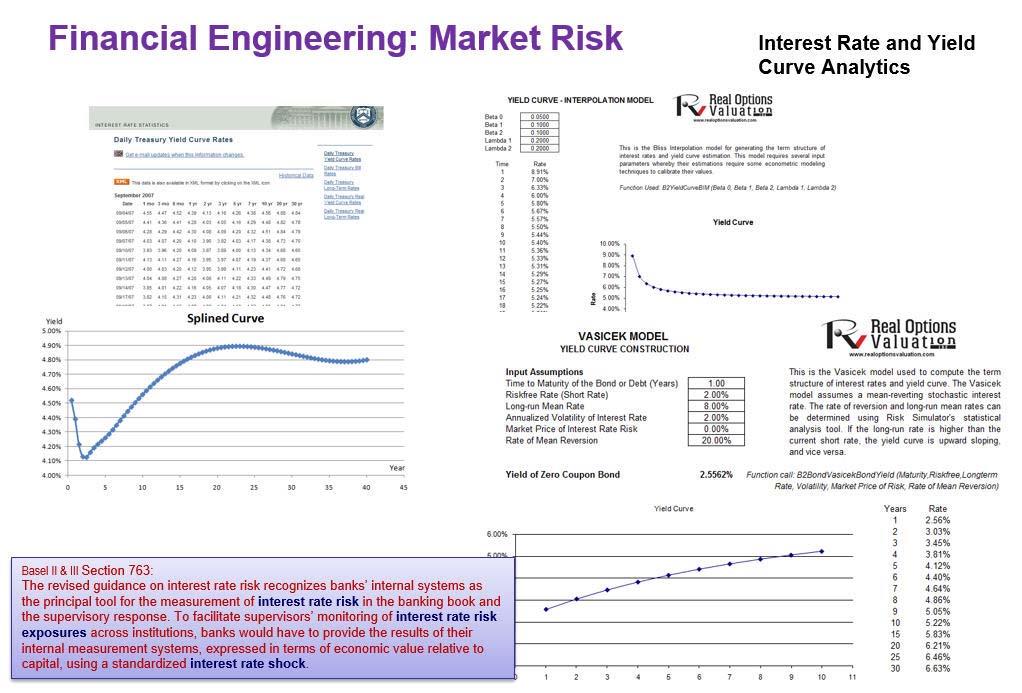
specifically Basel II and Basel III Section 733 and Annex 2’s Section 16. PD can be computed using structural models or based on historical data through running basic ratios to more advanced binary logistic models. Modeling Risk, 3rd Edition’s Chapter 7’s case study as well as Chapter 14’s Credit and Market Risk case study provide more insights into how PD can be computed using these various methods. - Figure 15 shows the simulation and generation of interest rate yield curves using Risk Simulator
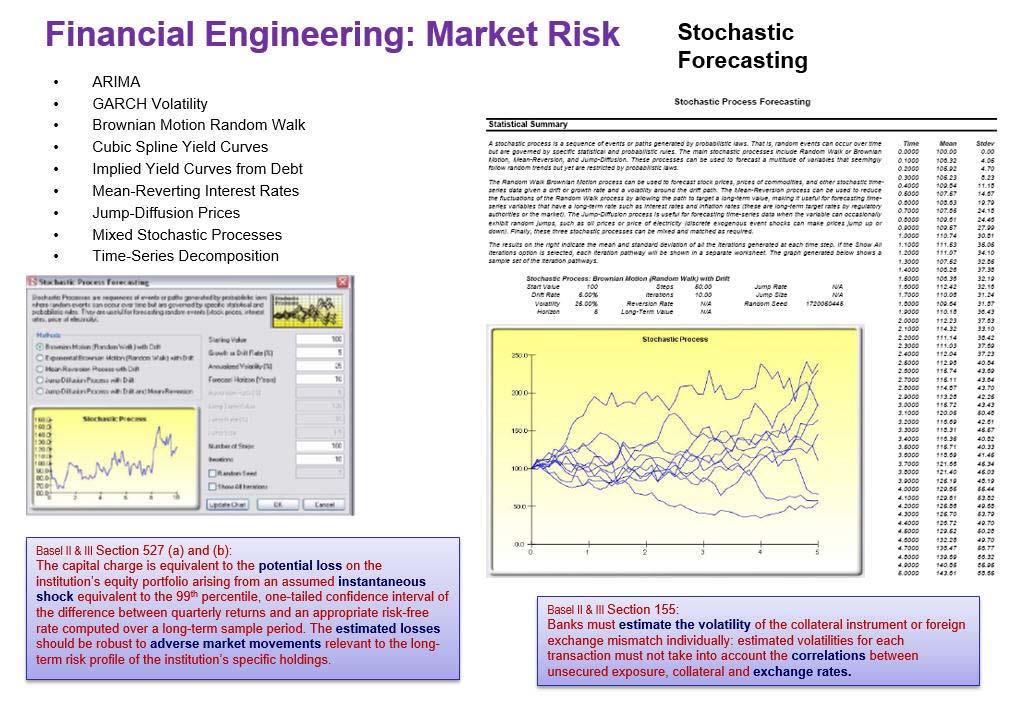
and Modeling Toolkit models. These methods are in line with Basel II and Basel III requirements Section 763 requiring the analysis of interest rate fluctuations and interest rate shocks. - Figure 16 shows additional models for volatile interest rate, financial markets, and other liquid
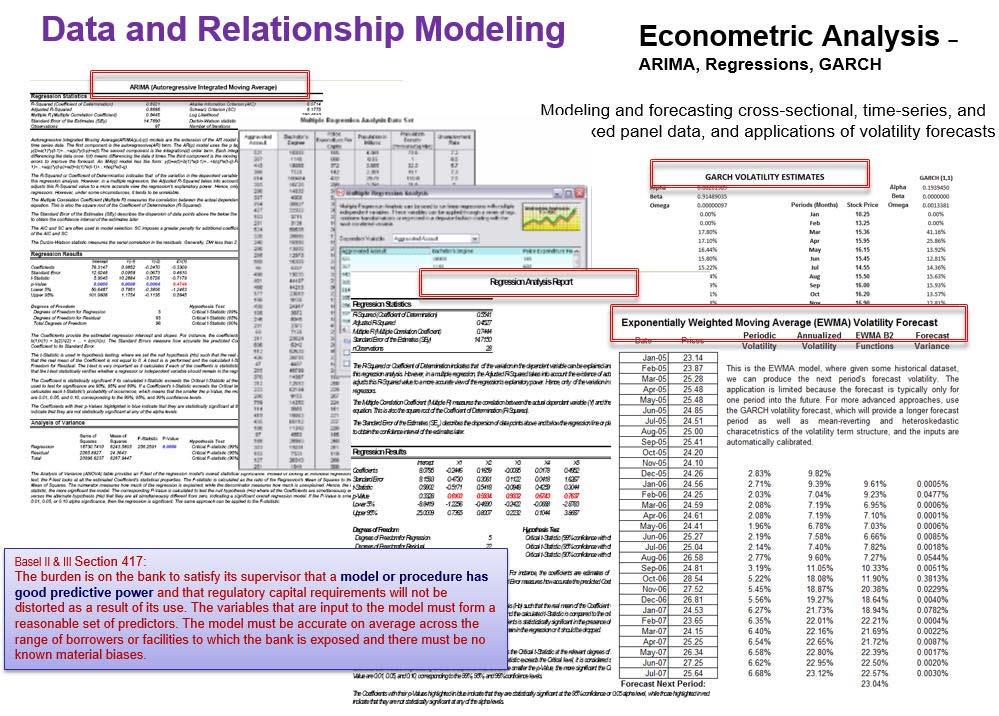
instruments’ instantaneous shocks using Risk Simulator’s stochastic process models. These analyses conform to Basel II and Basel III requirements Sections 155, 527(a), and 527(b). - Figure 17 shows several forecast models with high predictive and analytical power, which is a part
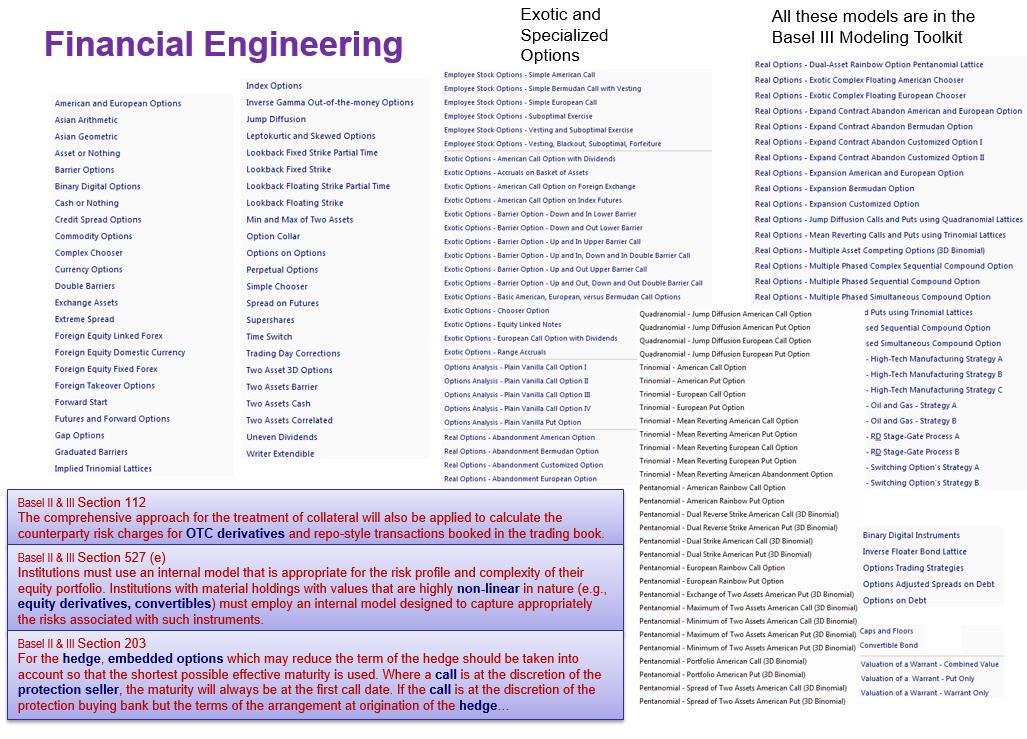
of the Risk Simulator family of forecast methods. Such modeling provides compliance with Basel II and Basel III requirements Section 417 requiring models of good predictive power. - Figure 18 shows the list of financial and credit models available in the ROV Modeling Toolkit and
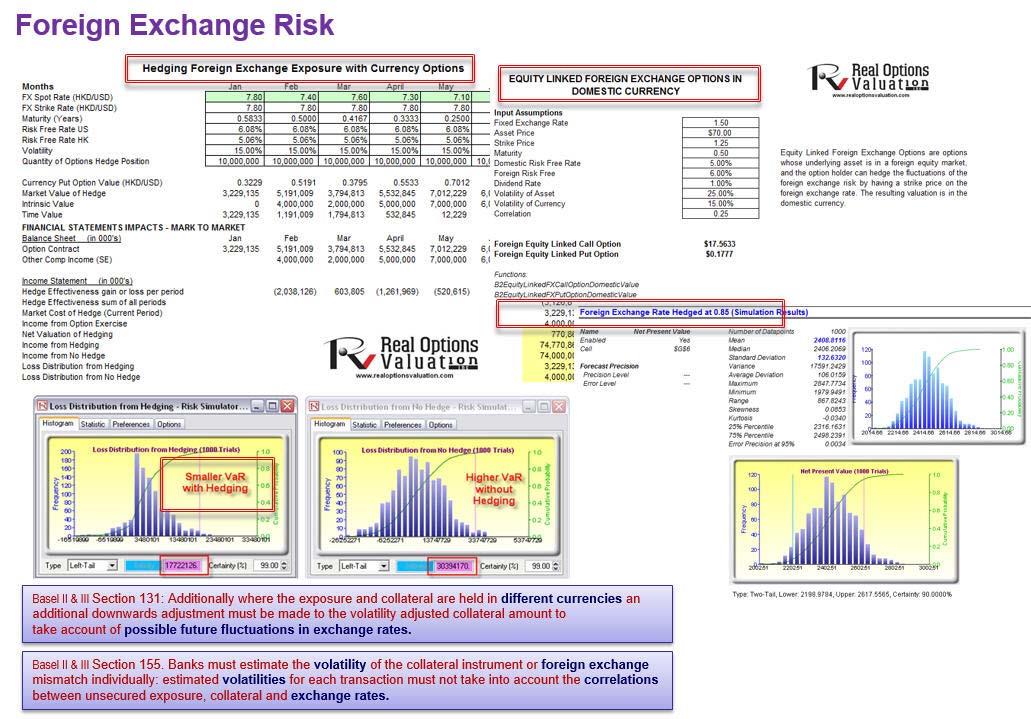
ROV Real Options SLS software applications. These models conform to Basel II and Basel III requirements Sections 112, 203, and 527(e) requiring the ability to value over‐the‐counter (OTC) derivatives, nonlinear equity derivatives, convertibles, hedges, and embedded options. - Figure 19 shows the modeling of foreign exchange instruments and hedges to determine the efficacy
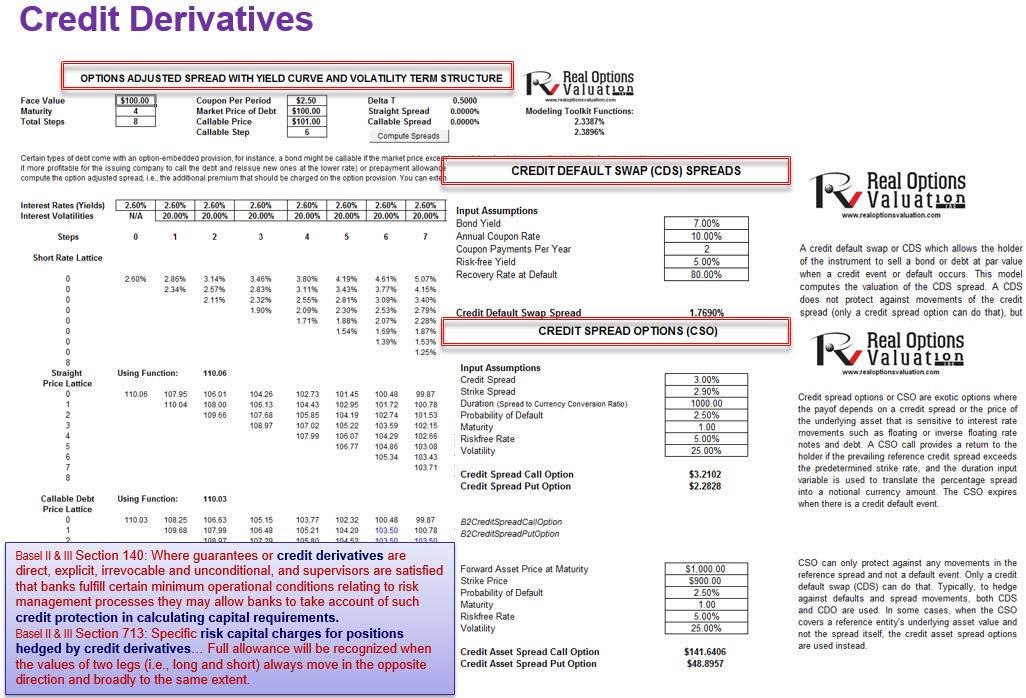
and effectiveness of foreign exchange hedging vehicles and their impact on valuation, portfolio profitability, and VaR, in line with Basel II and Basel III Sections 131 and 155 requiring the analysis of different currencies, correlations, volatility, and hedges. - Figure 20 shows the option‐adjusted spread (OAS), credit default swaps (CDS), and credit spread
options (CSO) models in ROV Modeling Toolkit. These models provide compliance with Basel II and Basel III requirements Sections 140 and 713 pertaining to modeling and valuing credit derivatives and credit hedges.
Compliance with COSO Integrated ERM Framework
The following provides a quick summary of COSO Integrated ERM Framework compliance when using the IRM methodology:
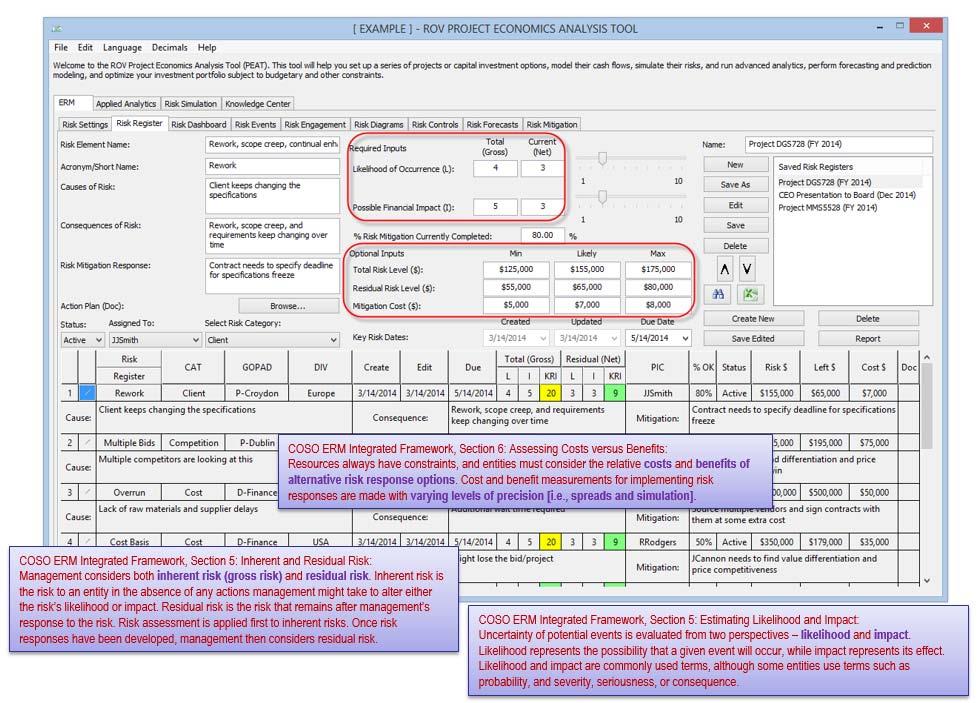
- Figure 21 (16.45) shows the PEAT ERM module’s Risk Register tab where mitigation costs and benefits (gross risks reduced to residual risk levels), likelihood and impact measures, and spreads with varying precision levels ready for Monte Carlo risk simulation are situated, in compliance with COSO ERM Framework Sections 5 & 6
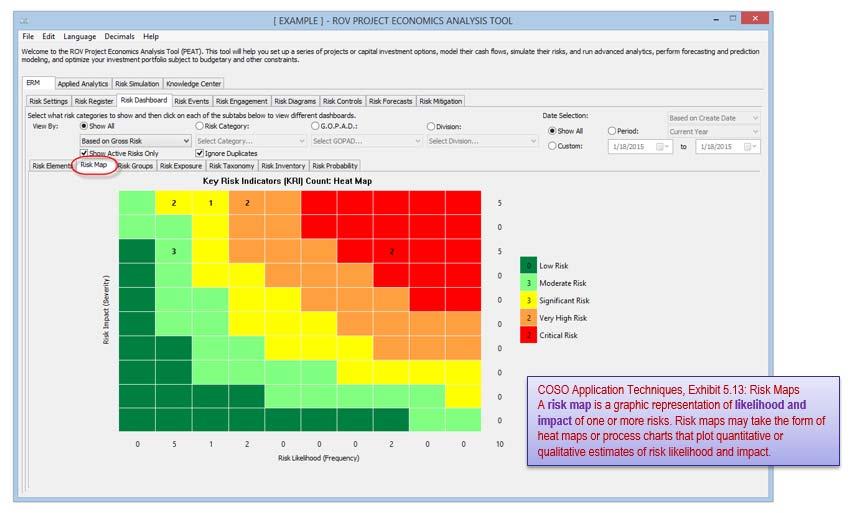
- Figure 22 (16.46) shows the PEAT ERM module where the likelihood and impact within a risk map is generated, in compliance with COSO AT/Exhibit 5.13.
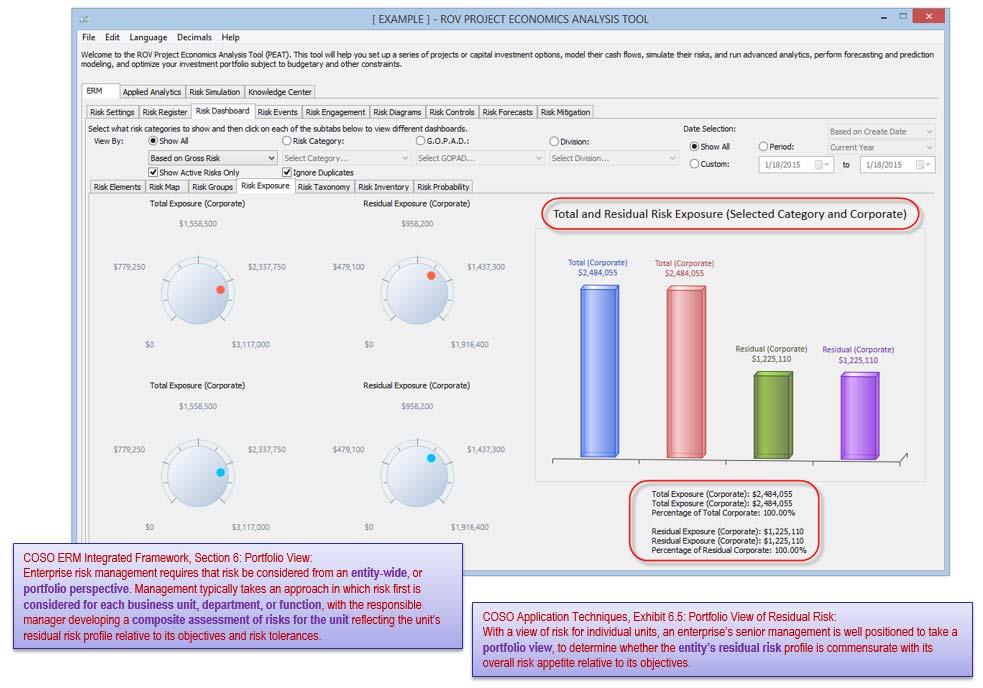
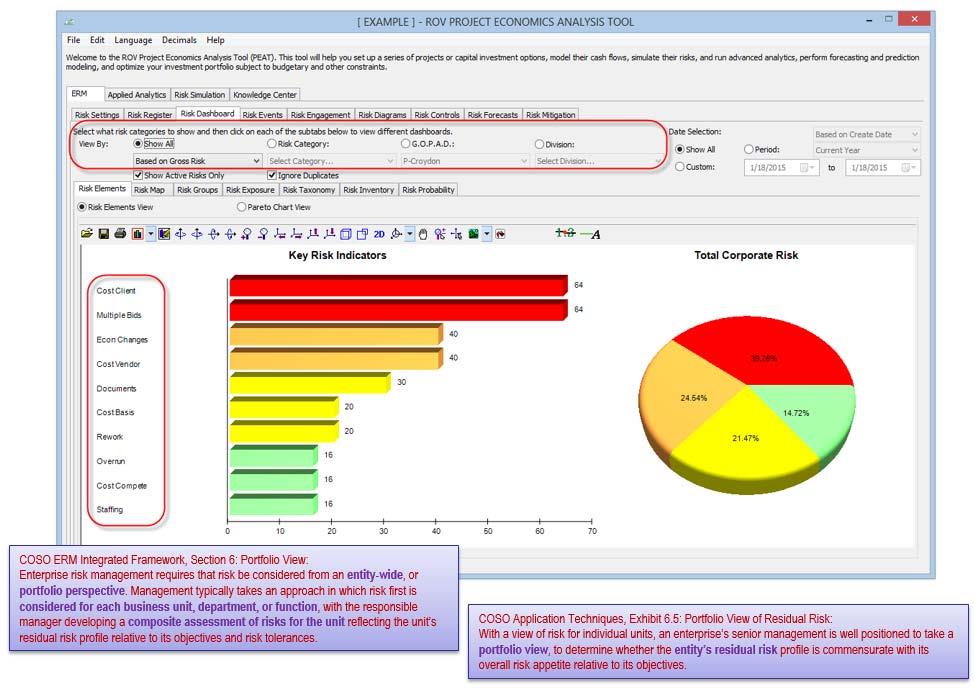
- Figure 23 (16.47) shows compliance with COSO AT/Exhibit 6.5 and COSO ERM Integrated Framework Section 6, where entity‐wide portfolio and business unit, department, and functional areas’ gross and residual risks are computed.
- Figure 24 (16.48) continues by showing a sample of the Risk Dashboard reports also in compliance with COSO AT/Exhibit 6.5 and COSO ERM Integrated Framework Section 6, where entity‐wide portfolio and business unit, department, and functional areas’ gross and residual risks are computed and compared against each other.
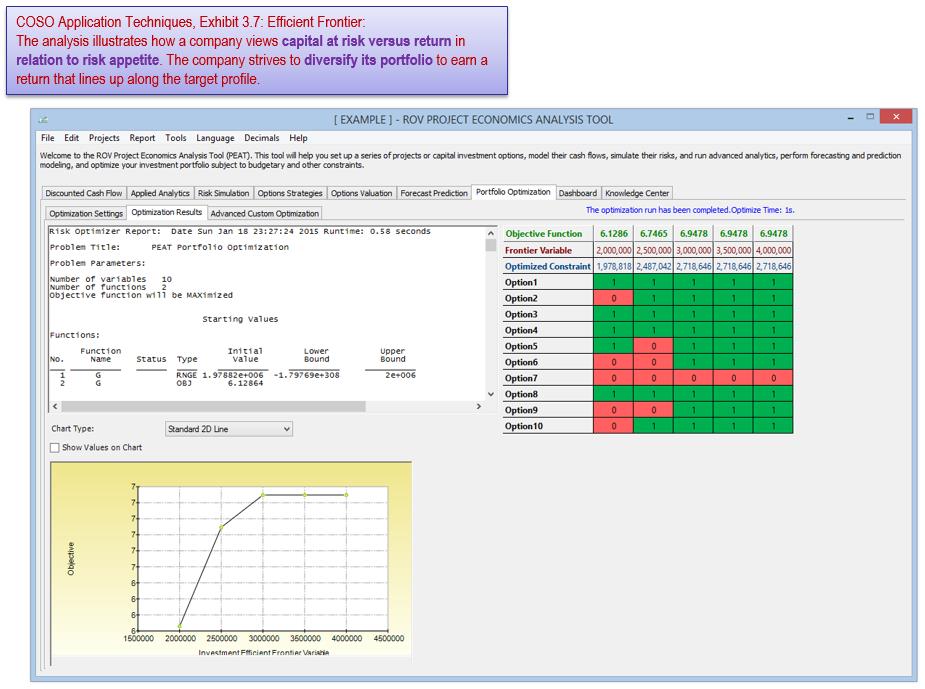
- Figure 25 (16.49) shows the PEAT DCF module’s efficient frontier model, consistent with COSO
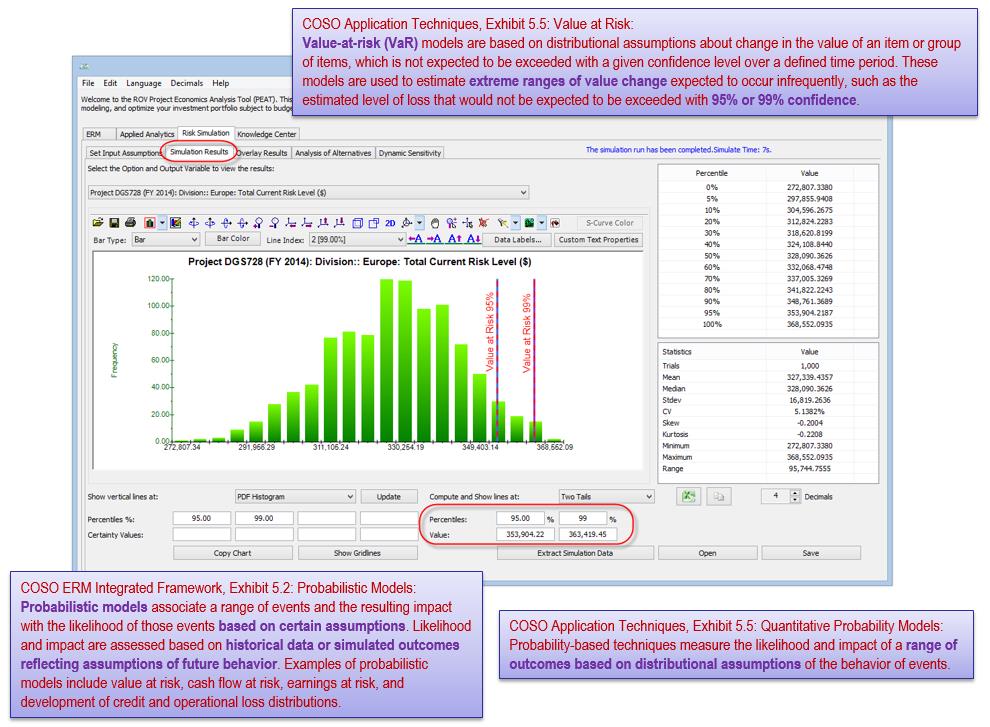
AT/Exhibit 3.7 requiring an analysis of the capital investment in relation to the returns within a diversified (optimized) portfolio. - Figure 26 (16.50) shows the PEAT ERM and DCF modules’ simulated results, where Value at Risk,
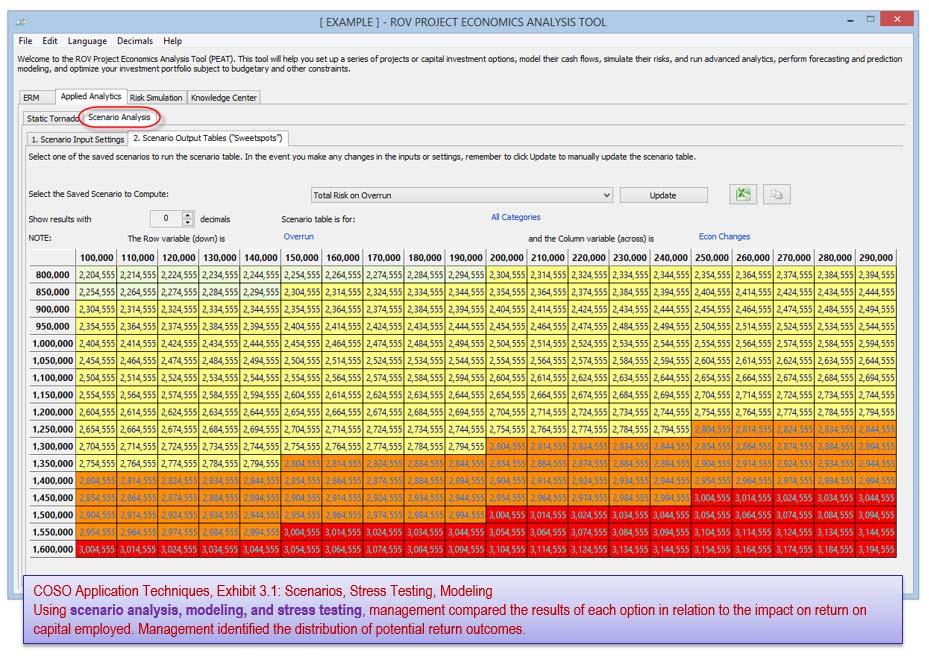
percentiles, and statistical probabilities can be obtained, in compliance with COSO AT/Exhibit 5.5 requiring a range of outcomes based on distributional assumptions, and COSO ERM Integrated Framework Exhibit 5.2 requiring historical or simulated outcomes of future behaviors under probabilistic models. - Figure 27 (16.51) shows compliance with COSO AT/Exhibit 3.1 requiring the use of scenario
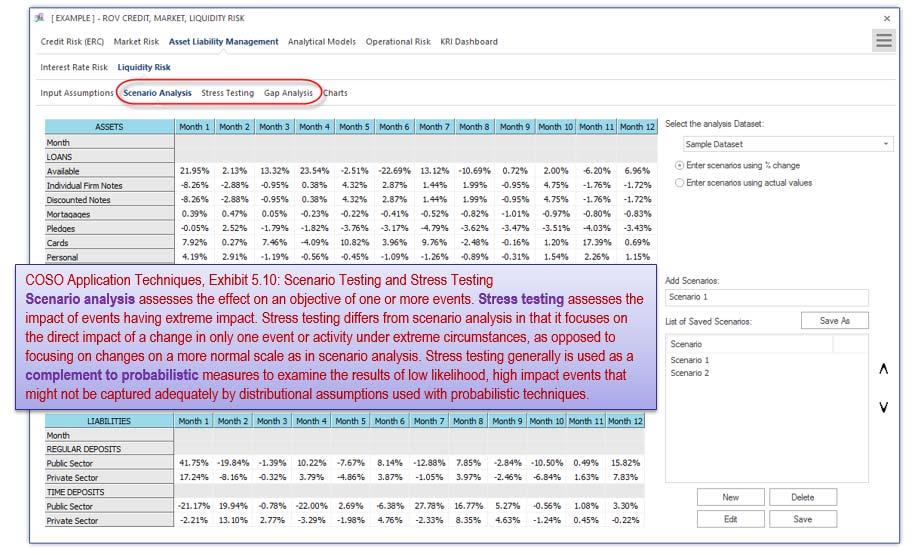
modeling and stress testing. - Figure 28 (16.52) shows the CMOL module in PEAT where scenario analysis, stress testing, and
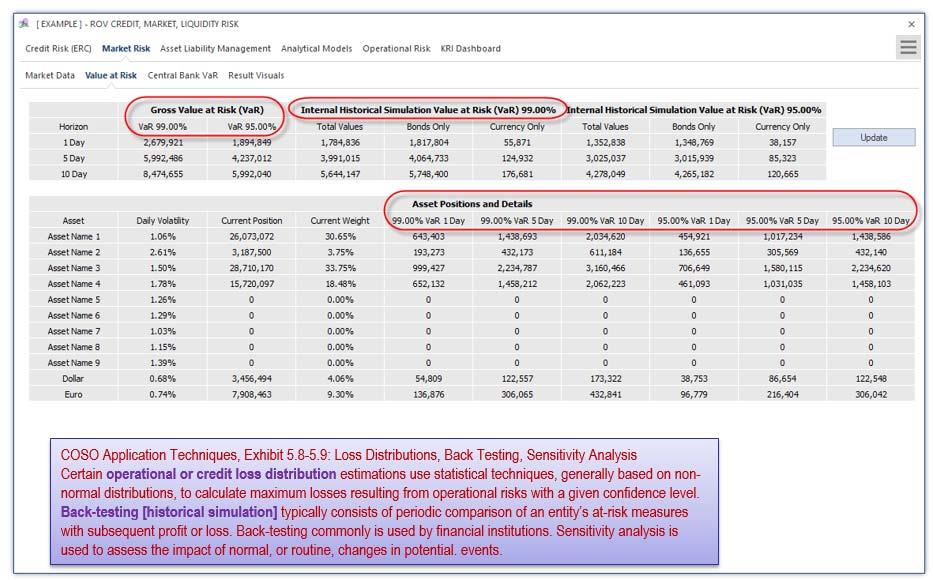
gap analysis are performed, in compliance with COSO AT/Exhibit 5.10, to complement probabilistic models. - Figure 29 (16.53) shows compliance with COSO AT/Exhibits 5.8 & 5.9 requiring the modeling of
operational and credit loss distributions with back‐testing or historical simulation, sensitivity analysis, and Value at Risk calculations.

Recent Comments