Percentile Distributional Fitting Tool
- By Admin
- October 21, 2014
- Comments Off on Percentile Distributional Fitting Tool
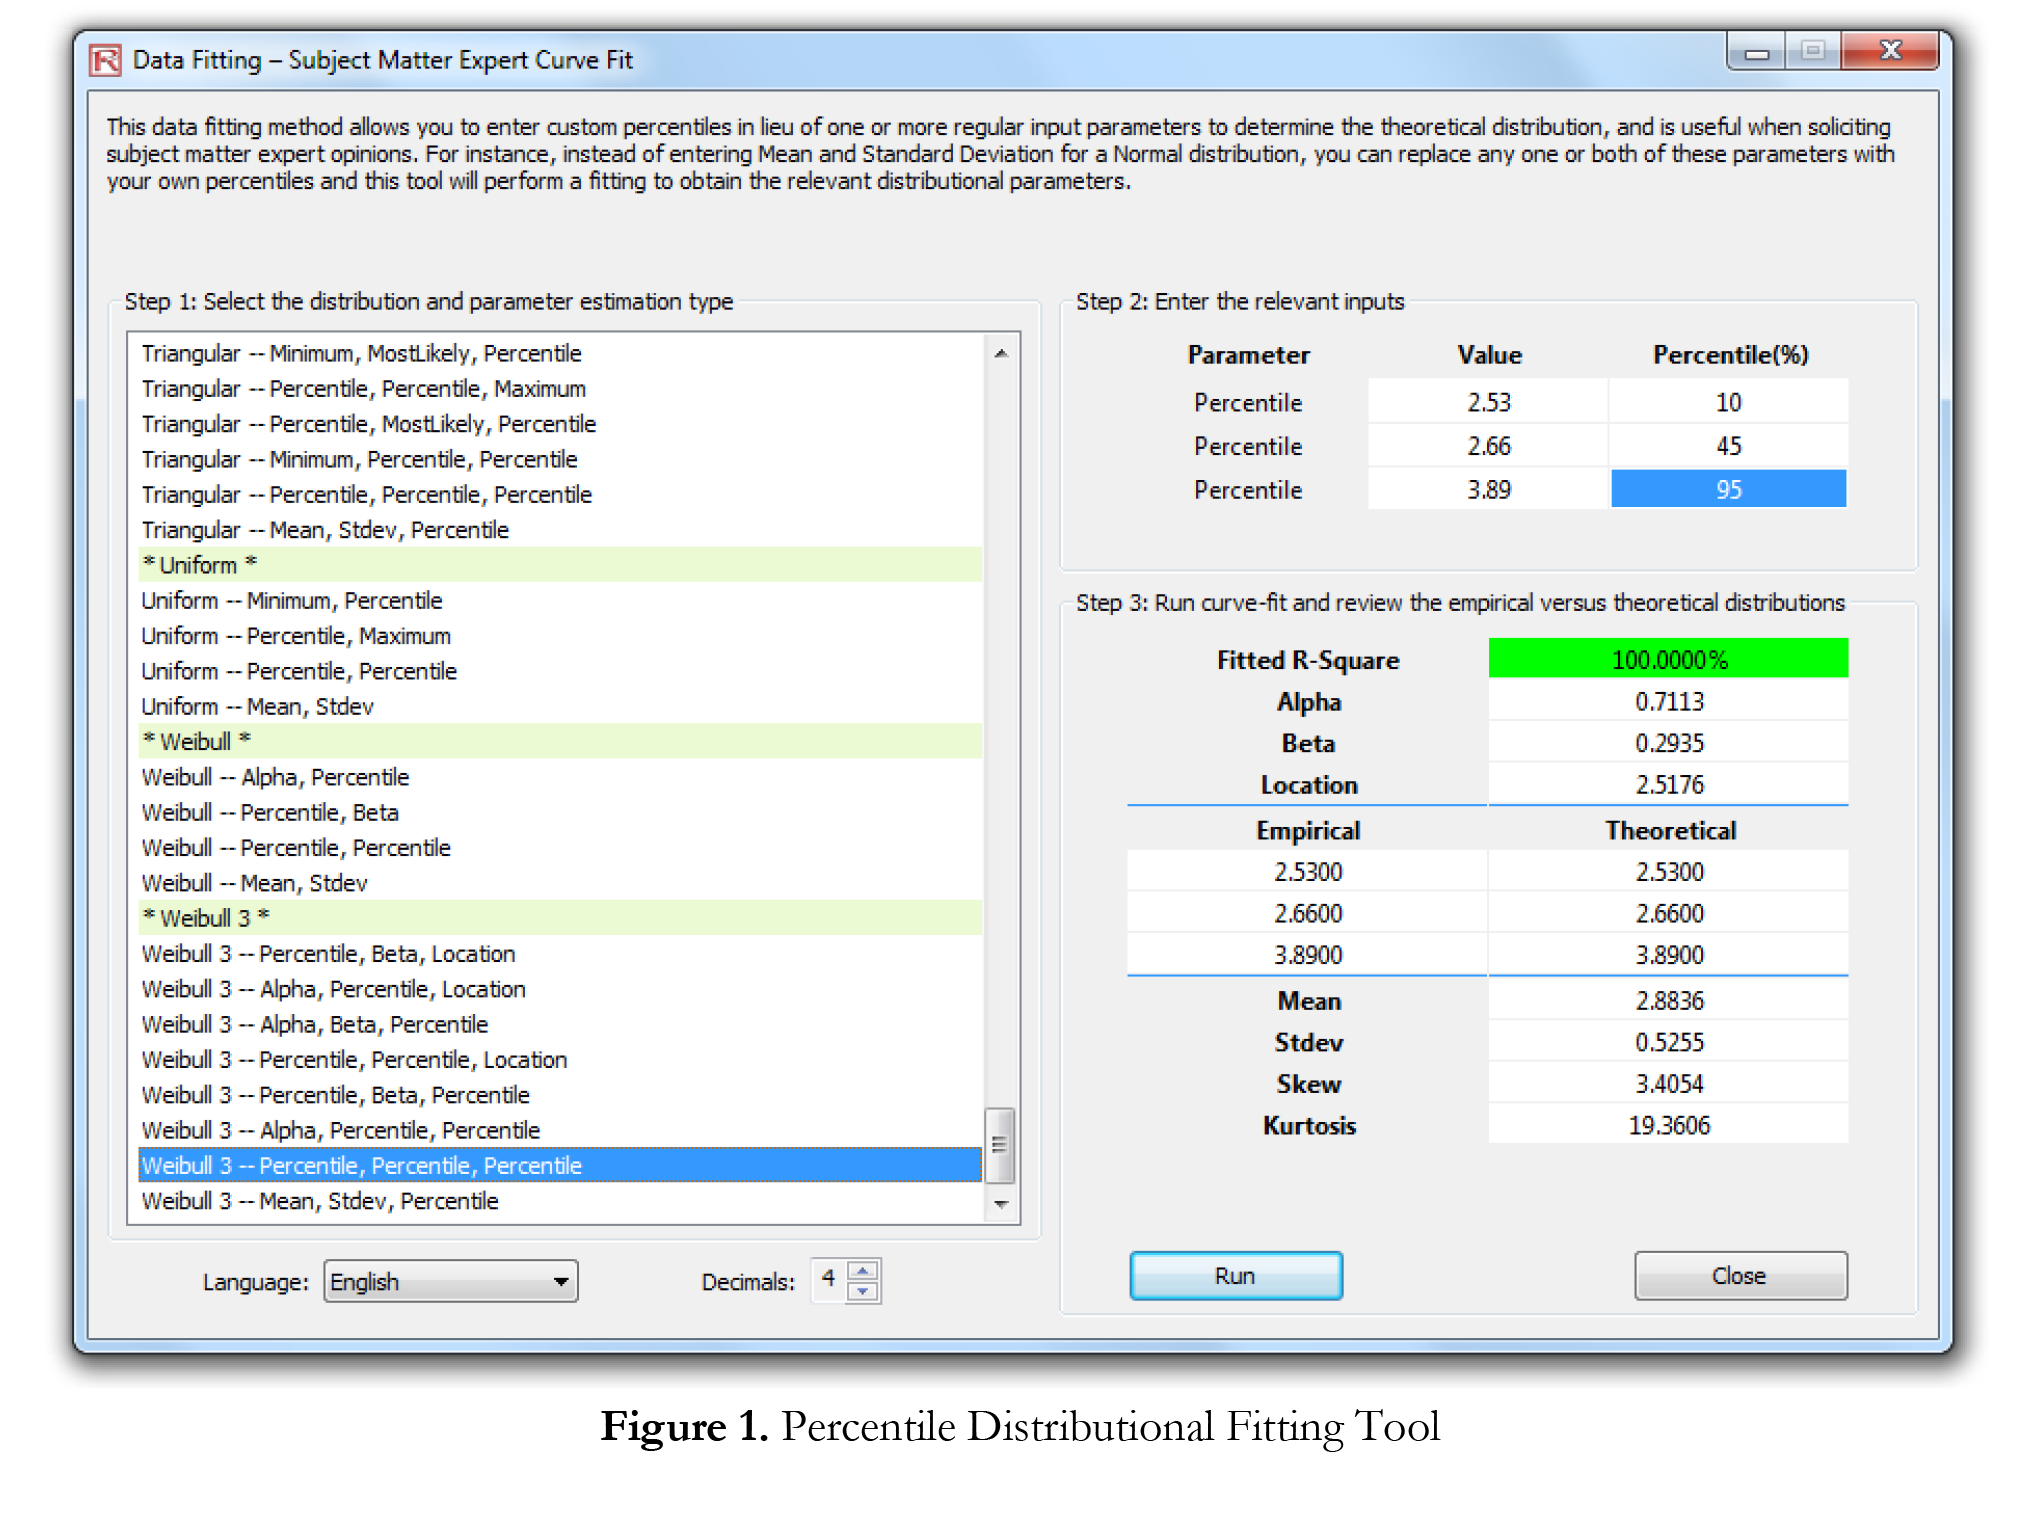
The Percentile Distributional Fitting tool (Figure 1) is an alternate way of finding and fitting the appropriate probability distributions to use in a simulation. There are several related tools and each has its own uses and advantages:
- Distributional Fitting (Percentiles)––the method described in this article, which uses an alternate method of entry (percentiles and first/second moment combinations) to find the best-fitting parameters of a specified distribution without the need for having raw data. This method is suitable for use when there are insufficient data or only when percentiles and moments are available, or as a means to recover the entire distribution with only two or three data points but the distribution type needs to be assumed or known. For instance, if you know the distribution type (e.g., normal, triangular, Weibull, et cetera) and some approximate values such as 10th percentile, median, standard deviation, 85th percentile, and so forth, you can fit the distribution (recover the entire distribution) using these limited information.
- Distributional Fitting (Single Variable)––using statistical methods to fit your raw data to all 42 distributions available in Risk Simulator to find the best fitting distribution and its input parameters. Multiple data points are required for a good fit, and the distribution type may or may not be known ahead of time. You can apply multiple statistical fitting methods such as the Akaike Information Criterion, Anderson- Darling, Bayes Criterion, Chi-Square, Kolmogorov-Smirnov, Kuiper’s Statistic, and Schwartz Criterion, all within Risk Simulator and its BizStats module.
- Distributional Fitting (Multiple Variables)––using statistical methods to fit your raw data on multiple variables at the same time. This method uses the same algorithms as the single-variable fitting, but incorporates a pairwise correlation matrix between the variables. Multiple data points are required for a good fit, and the distribution type may or may not be known ahead of time.
- Custom Distribution (Set Input Assumption)––using nonparametric resampling techniques to generate a Custom distribution (simply create a new or open an existing profile, set an input assumption and select Custom distribution, then either manually enter or paste in some raw data) to simulate the distribution based on this empirical distribution. Fewer data points are required, and the distribution type is not known ahead of time, and is most appropriate when eliciting information from subject matter experts (also known as the Delphi method).
Procedure
Click on Risk Simulator | Tools | Distributional Fitting (Percentiles), choose the probability distribution and types of inputs you wish to use, enter the parameters, and click Run to obtain the results. Review the fitted R-square results and compare the empirical versus theoretical fitting results to determine if your distribution is a good fit.

Recent Comments