Basic Econometrics
- By Admin
- November 19, 2014
- Comments Off on Basic Econometrics
Theory
Econometrics refers to a branch of business analytics, modeling, and forecasting techniques for modeling the behavior or forecasting certain business, financial, economic, physical science, and other variables. Running the Basic Econometrics models is similar to regular regression analysis except that the dependent and independent variables are allowed to be modified before a regression is run. The report generated is the same as shown in the Multiple Regression article and the interpretations are identical to those described in that article.
Procedure
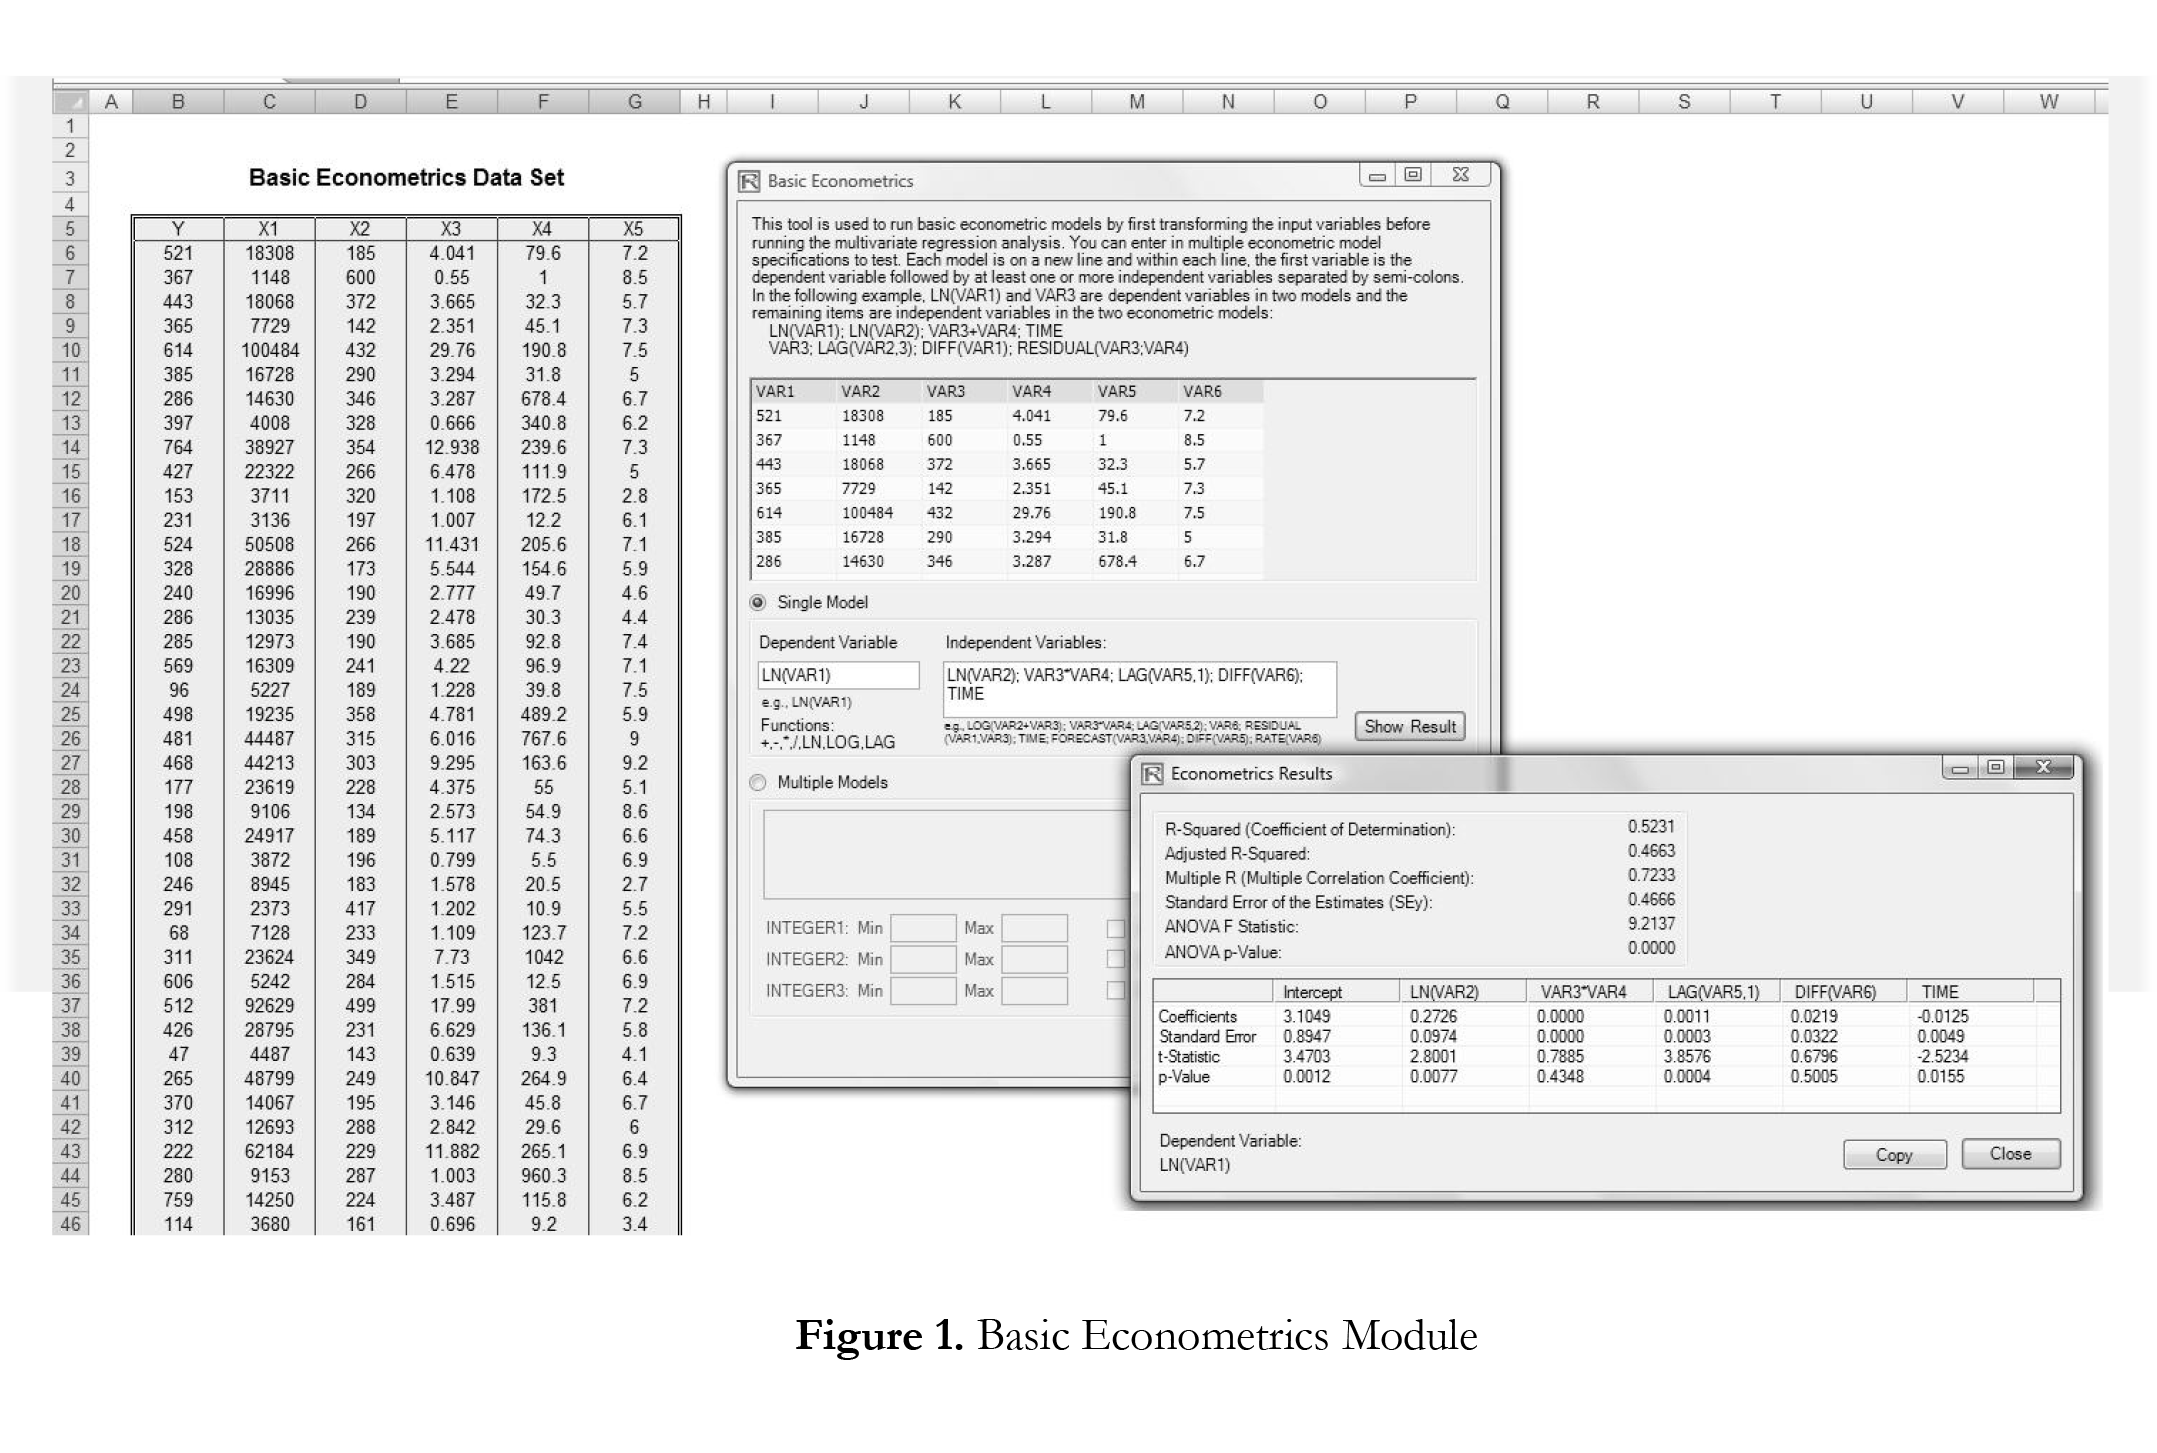
- Start Excel and enter your data or open an existing worksheet with historical data to forecast (the illustration shown in Figure 1 uses the file example file Advanced Forecasting Models in the Examples menu of Risk Simulator).
- Select the data in the Basic Econometrics worksheet and select Risk Simulator | Forecasting | Basic Econometrics.
- Enter the desired dependent and independent variables (see Figure 1 for some basic examples) and click OK to run the model and report, or click on Show Results to view the results before generating the report in case you need to make any changes to the model.
Notes
- To run an econometric model, simply select the data (B5:G55) including headers and click on Risk Simulator | Forecasting | Basic Econometrics. You can then type in the variables and their modifications for the dependent and independent variables (Figure 1). Note that only one variable is allowed as the Dependent Variable (Y), whereas multiple variables are allowed in the Independent Variables (X) section, separated by a semicolon (;) and that basic mathematical functions can be used (e.g., LN, LOG, LAG, +, -, /, *, TIME, RESIDUAL, DIFF). Click on Show Results to preview the computed model and click OK to generate the econometric model report.
- You can also automatically generate multiple models by entering a sample model and using the predefined INTEGER(N) variable as well as Shifting Data up or down specific rows repeatedly. For instance, if you use the variable LAG(VAR1, INTEGER1) and you set INTEGER1 to be between MIN = 1 and MAX = 3, then the following three models will be run: first LAG(VAR1,1), then LAG(VAR1,2), and, finally, LAG(VAR1,3). Also, sometimes you might want to test if the timeseries data has structural shifts or if the behavior of the model is consistent over time
by shifting the data and then running the same model. For example, if you have 100 months of data listed chronologically, you can shift down 3 months at a time for 10 times (i.e., the model will be run on months 1–100, 4–100, 7–100, etc.). Using this Multiple Models section in Basic Econometrics, you can run hundreds of models by
simply entering a single model equation if you use these predefined integer variables and shifting methods.

Recent Comments