CASE STUDY: EMPLOYER SPONSORED HEALTHCARE INSURANCE; REAL OPTIONS STRATEGIES, ANALYTICS, AND THE U.S. AFFORDABLE CARE ACT1
- By Admin
- April 1, 2015
- Comments Off on CASE STUDY: EMPLOYER SPONSORED HEALTHCARE INSURANCE; REAL OPTIONS STRATEGIES, ANALYTICS, AND THE U.S. AFFORDABLE CARE ACT1
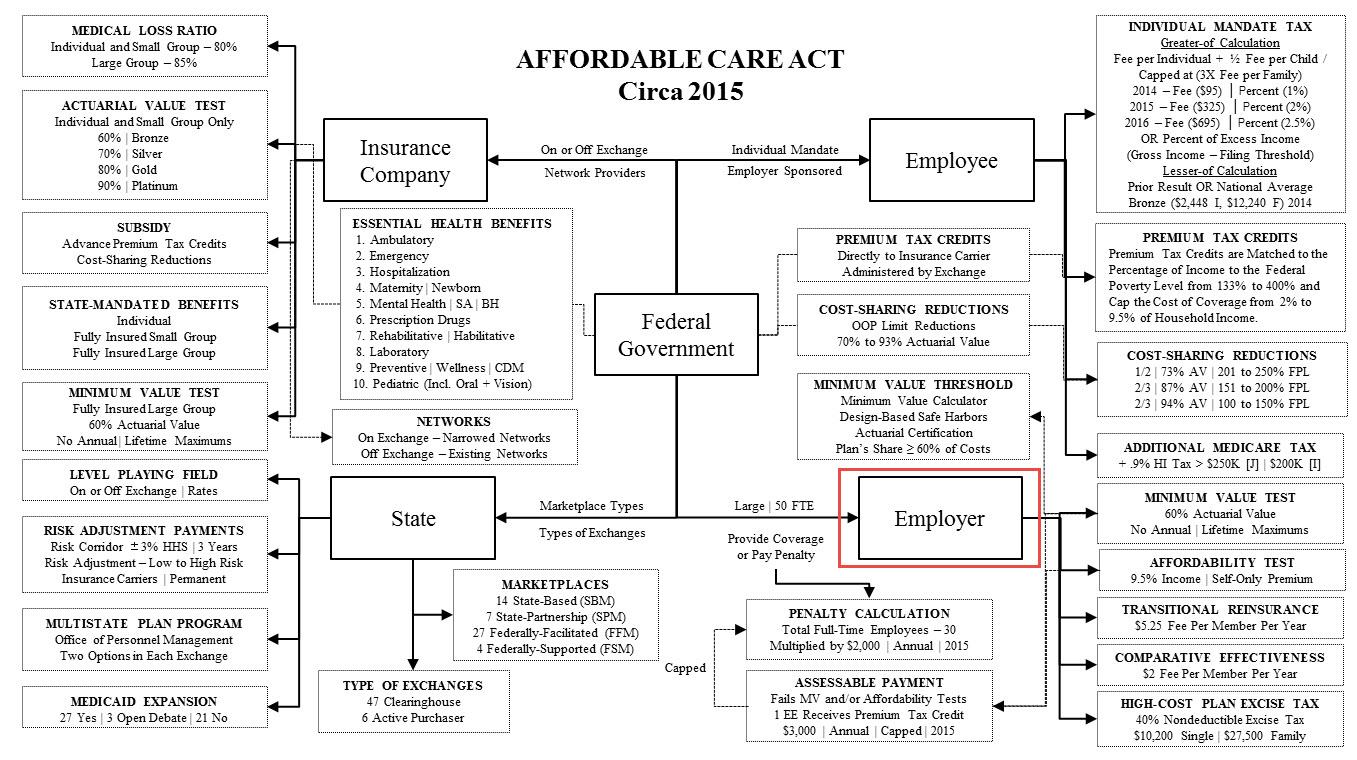
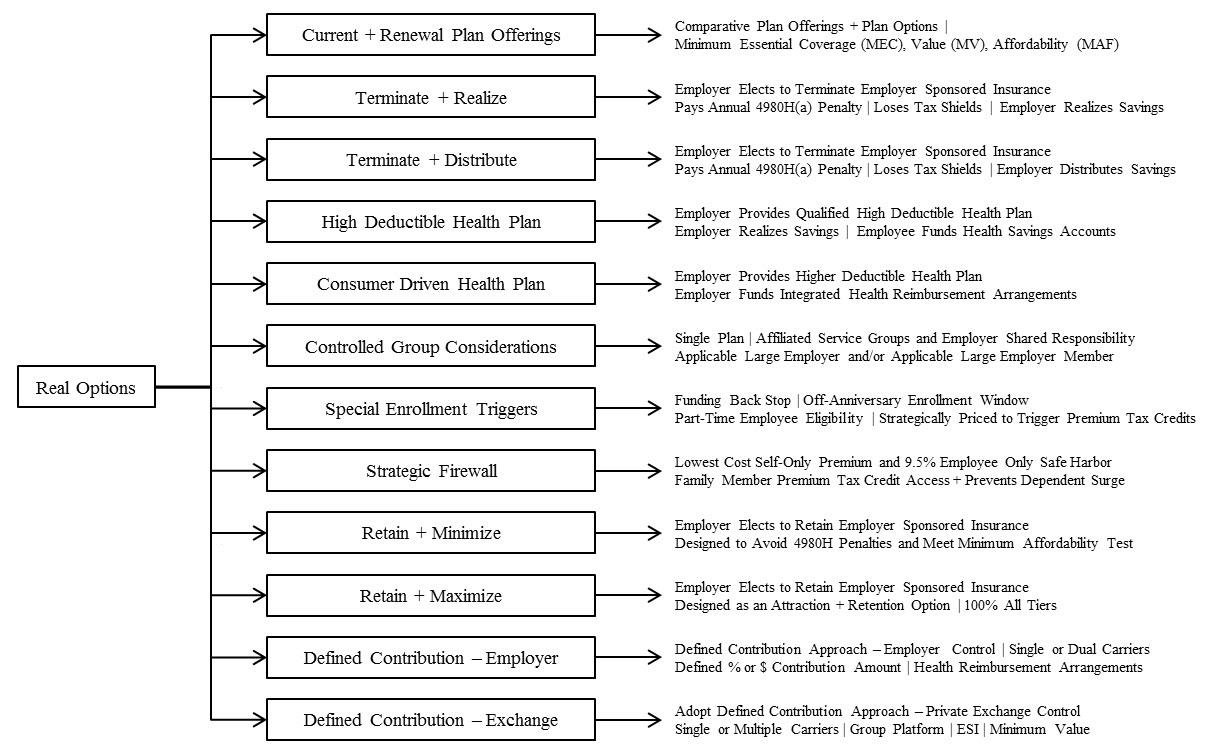
The United States passed major healthcare reform legislation in March 2010, hereafter referred to as the Affordable Care Act (ACA). It is complicated and has many moving parts. Figure 14.149 identifies the key healthcare finance stakeholders and their moving parts. What makes this so important is that public and private healthcare spending within the United States is 17.6% of a $15.8 trillion gross domestic product, which equates to $8,233 per person. As such, the changes brought about by this legislation have created a monumental disruption opportunity as employers strategize what to do with respect to their employer‐sponsored insurance offerings. Our focus here is on the employer‐sponsored health insurance portion of the ACA because even though this system is currently subsidized through the tax code with the deductibility of the employers’ contributions from the corporation and the exclusion from the taxable income of the employee for these employers’ contributions, employers need to assess and determine what option is optimal in creating value as they define it. Figure 14.150 illustrates a sampling of strategic real options an employer may review when managing its healthcare exposure.
The Decision‐Making Process
The economic pressures to know, quantify, select, and execute are critical in the control of health‐care costs. However, the process begins with setting the goals (Goals), outlining the strategy (Strategy), selecting the tactics (Tactics), implementing the strategy (Implementation) and applying the controls (Control). What follows is a discussion of the interrelationship of these elements and how, as we speak to the strategic options development, financial analytics, and modeling, they are integrated into the overall process.
Goals —Setting goals involves the systematic approach of developing an understanding of the sources of company value. This activity identifies trade‐offs between monetary and nonmonetary benefits, increasing revenues versus decreasing expenses, and attempting to attract and retain human capital while trying to effectively manage plans to the market, and so on. The key considerations in alignment may be cost‐focused, revenue‐focused, market‐focused, customer‐focused, and employee‐focused goals.
- Review Corporate Mission Statement
- Identify Business Strategy
- Discover Key Business Objectives
- Align Plan Objectives
- Establish Key Performance Metrics
StrategyDeveloping a strategy outlines the logic of the organization’s approach directed at achieving its goals and involves the identification and understanding of the underlying issues, the development
and quantification of strategic options, the narrowing of the options for consideration, and the
presentation of these options for selection and evaluation.
- Issue Identification
- Strategic Options Development
- Strategy Identification
- Strategy Evaluation
Tactics Tactics comprise the mix of actionable elements that are deployed in support of the desired strategy with the three‐fold objective to create, communicate, and deliver value. Value creation defines
the processes used to capture the value for organization and its employees, value communication brings
the awareness of the value to the stakeholders, and value delivery transfers the captured value to the
organization and its employees.
- Financial Analytics and Modeling
- Health Plan Analytics
- Health Risk Management
- Networks and Network Effectiveness
- Pharmacy Analytics
Implementation Developing an implementation plan provides an outline of the timeline for executing the strategy and tactics. The two key factors in implementation are the processes that enable the company to implement its strategy and tactics and the people managing the processes. The underlying processes are the logistics that support the company to achieve its goal and deliver value. The people are the human‐resources dimension of implementation and the identification of the core skills and knowledge of the people involved.
ControlThe policy for evaluating the performance and monitoring of the effectiveness of the strategy to ensure the adequate progress toward the set goal involves applying controls. A control is designed to continually assess the viability of the strategies and tactics through the use of key performance metrics and to provide environmental updates from the market that educate and inform as to newly issued regulations or legislation, plan design considerations, and emerging technologies for assessment.
- Reporting
- Per Capita Results
- Plan Utilization Metrics
- Productivity Costs
- Aggregate Financials
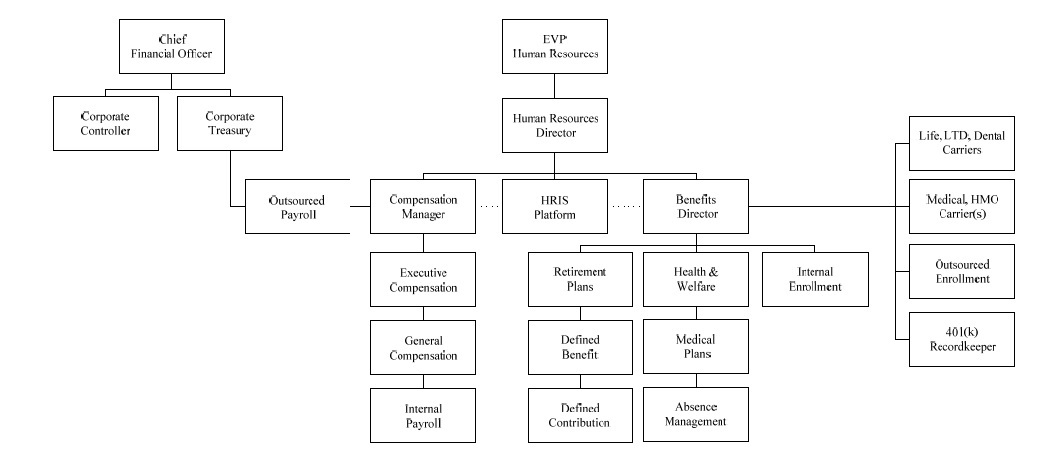
This is no small task as there are multiple stakeholders involved in the process (see Figure 14.151) and each participant does not have the exact same finance or benefits background or understanding of the nuances for each option, yet each is still accountable and responsible for the decisions. Thus it is even more critical to convert any analysis into the level of understanding for the decision makers to make it clear, concise, and actionable.
Strategic Options Development
As noted earlier, the ACA has generated many opportunities for an employer’s consideration:
- A fully insured employer may elect to self‐fund to avoid state‐mandated benefits requirements, eliminate insurance premium taxes and take advantage of the favorable experience and pay‐asyou go cash flow funding flexibility through Employee Retirement Income Security Act (ERISA) preemption and gain more control over their plan design that meets the minimum value actuarial requirements under the ACA.
- An employer may elect to not offer or to terminate their employer‐sponsored insurance coverage as an enterprise paying the 4980H(a) annual penalty of $2,000 for each full‐time employee not being offered coverage (less the first 30 full‐time employees), losing its tax shield (penalty is non‐deductible), retaining or distributing the savings in the event the cost is lower than their current arrangement, and shifting the decision to its employees as to whether they will elect to pay the individual mandate penalty, gain coverage as a dependent on another group plan, secure coverage in the private insurance market or opt for coverage in the state‐based, state‐partnership, federally‐facilitated or federally‐supported marketplaces.
- An employer may elect to continue to provide employer‐sponsored insurance through the group platform, but decide to adopt a defined contribution strategy for its employees. This may take the form of continuing with the current level of coverage and multiple plan options with one or multiple carriers, contracting with a carrier to gain access to its private exchange and networks,
or directly contracting with a private exchange to gain access to multiple carriers and networks. - An employer may elect to continue to provide employer‐sponsored insurance, but look at a strategy that looks at the implications of dramatically altering coverage geographically as the cost of coverage may no longer be sustainable in a particular region of the country. This may mean either a hybrid funding arrangement to shift high cost users into a fixed cost environment, plan design changes and or a termination strategy that anti‐selects against the public exchange.
- An employer may decide to effectively provide employee‐only coverage with an offer of coverage for dependent children to age 26, but specifically excluding an offer of spousal coverage. Utilizing both eligibility and contributions, the objectives are to prevent a surge of dependents who would be eligible to be covered as dependents on the plan resulting from the termination of employer‐sponsored insurance coverage by surrounding employers, and to allow the triggering of premium tax credits and cost‐sharing reductions for its own noncovered dependents which are otherwise not available because spouses were eligible for employer‐sponsored insurance
coverage as a dependent.
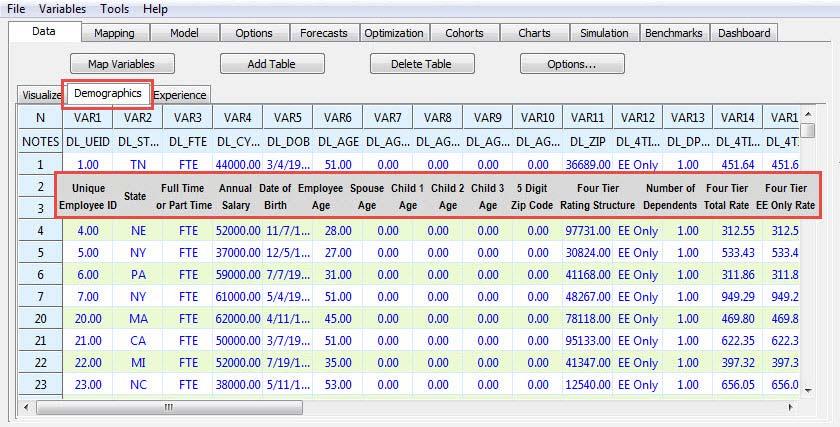
Employers need to know how to model these types of options and risks. One way is to take the demographic and financial data of the company, integrate it with the marketplace data and illustrate the financial impact of the options by comparing it to the current structure and program. Figure 14.152 shows how the modeling process is initiated by mapping the data to calculate the options using the Health Quant Data Modeler (HQDM) utility.
After the options have been calculated and the option variables have been settled (i.e., whether to include or exclude part‐time employees, to expand premium tax credits to those with family coverage or illustrate for the employee only, to illustrate the individual income tax impact resulting from the loss of the IRC § 106 tax‐favored employer contribution towards employer‐sponsored insurance coverage which means the gross income of an employee does not include the contributions that the employer makes to an accident or health plan, etc.), things get more interesting. First we review the strategic options developed and their cost (Figure 14.153) and then progress to the next stage of additional financial analytics and modeling.
- Current Option. This is the net cost to the employer under the current employer‐sponsored insurance arrangement. It is calculated by deducting employee contributions and the corporate tax shield from the total cost of coverage (Figure 14.153, Reference A).
- Termination Option. The option is to not offer minimum essential coverage to full‐time employees (FTEs). The net cost is the sum of the Employer‐Shared Responsibility assessable payments of $2,000 per full‐time employee multiplied by the total number of FTEs minus the first 30 FTEs with the lost tax shield resulting from the non‐tax‐deductibility of the assessable penalty payments added back (Figure 14.153, Reference B).
- Consumer‐Driven Health Plan Option. The option is to offer employer‐sponsored insurance for all employees using a qualified high deductible health plan (HDHP) with a health savings account (HSA) or a higher‐deductible health plan using an integrated health reimbursement arrangement (HRA) with the employer funding $500 in the account for each participant. The net cost for the option is gross premium for the coverage plus the account contribution less employee contributions and corporate tax shields (Figure 14.153, Reference C).

- Strategic Firewall Option. This option is to offer employer‐sponsored insurance for employeesonly and dependent children up to age 26. The net cost to the employer under the current employer‐sponsored insurance arrangement is calculated by deducting employee contributions and the corporate tax shield from the total cost of coverage (Figure 14.153, Reference D).
- Minimum Compliance Option. This option is to offer employer‐sponsored insurance for
employees only and dependent children up to age 26 and minimize the employer’s contribution toward the cost of coverage to the level that meets the minimum affordability requirement established by the IRS, that is, the level where the employee’s contribution for self‐only premium for the lowest‐cost coverage that provides minimum value that is less than 9.5% of the employee’s W‐2. The net cost to the employer under the employer‐sponsored insurance
arrangement is calculated by deducting employee contributions and the corporate tax shield from the total cost of coverage (Figure 14.153, Reference E). - Attraction and Retention Option. This option is to offer employer‐sponsored insurance coverage and use it as a talent attraction and retention instrument. It offers coverage with the employer contributing 100% for all tiers of coverage. The net cost to the employer is the total cost of
coverage less the corporate tax shields (Figure 14.153, Reference F). - Defined‐Contribution Option. This option is for the employer to define an amount as a percentage of salary, a flat dollar, or a combination toward the cost of employer‐sponsored insurance. This illustration uses a formula with a cap of $5,000 per participant. The employer continues to offer coverage on a group basis with its contributions structured under a tax‐favored approach (i.e., integrated health reimbursement arrangements [HRA], employer‐funded health savings accounts [HSA], or a credit‐based cafeteria plan [IRC § 125]). The coverages offered are assumed to be multiple options administered by one carrier directly contracting with the employer where the actuarial values of the options range from 60% to 80%. The net cost to the employer under
this option is the employer’s defined contribution amount less the corporate tax shields (Figure
14.153, Reference G).
Strategic options development is an important first step, but additional steps are required in the review process for each option before a decision can be made. In other words, the options create the framework and the additional modeling and analytics assist in facilitating a decision. To provide one illustration, we will focus on the termination option with the understanding that the other options also create similar types of derivatives.
Termination Option Example
We see in Figure 14.154 that the net cost of this option is $6,777,780 compared to the current net cost of coverage at $15,502,684. In what follows (see Figure 14.154), this cost includes the penalty plus the cost of the lost tax shield. As shown, there is a net savings of $8,724,903, and should an employer continue to sponsor health coverage this spread would be perennially realized as the difference between the trended healthcare costs and the cost for termination (the required penalty and lost tax shield).
In short, a large employer must either offer at least 95% of its full‐time employees the opportunity to enroll in an employer‐sponsored health insurance program or pay an annual penalty of $2,000 for each full‐time employee less the first 30 full‐time employees. If the employer offers such coverage, it is considered to have met the definition of an “offer” of minimum essential coverage. If the full‐time employees elect not to take up the coverage, this has no impact on the penalty calculation because the only issue is whether coverage has been offered.
Notwithstanding the offer of coverage as previously noted, if the offer of coverage is either not affordable (i.e., the employee‐only contribution for the lowest cost self‐only coverage is greater than 9.5% of the employee’s W‐2 income) or it does not meet the minimum value requirement (i.e., the value of the coverage is less than an actuarial value of 60%), the employer will be responsible for a 4980H(b) assessable payment penalty of $3,000 for each full‐time employee to which these conditions apply and who also receives a premium tax credit. However, the accumulation of these penalties will never exceed the penalty amount that would be assessed if the employer did not offer coverage (4980H(a) penalty amount, which, as noted, is the total number of full‐time employees less the first thirty full‐time employees multiplied by $2,000. This termination option illustrates the cost for the employer if it elected to not offer coverage.

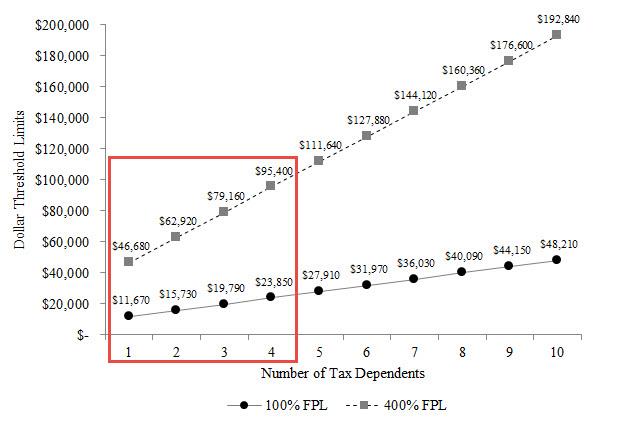
What the additional modeling illustrates are the additional dimensions of such a decision. For example, what if an employer offers minimum essential coverage and either prices it such that it is not affordable or offers a plan that does not meet the minimum value test (or both)? What is often not taken into consideration is that penalties are not assessed if the full‐time employee is not receiving a premium tax credit from a state‐based, state‐partnership, federally‐facilitated or federally‐supported marketplace (as of this writing). There are multiple reasons when a full‐time employee whose wage alone is the basis for the premium tax credit would never realize the tax credit. The chart in Figure 14.155 shows the low end of the range (i.e., 100% of the federal poverty level) and the high end of the range (i.e., 400% of the federal poverty level) for each tax dependent level that is used as the basis for premium tax credit calculations. An example of someone not realizing the premium tax credit would be an employee who earns $50,000 per year, has two tax dependents (i.e., employee + spouse coverage), and calculates the standalone situation as eligible for a premium tax credit ($50,000 is greater than $15,730 and less than $62,290 for two tax dependents). However, the employee and spouse’s modified adjusted gross income might be $85,000 (greater than $62,290) and, therefore, pushes them out of the range.
What if the employees opted for coverage on their spouse’s plan? What if they opted to pay the higher contributions and remain on the employer’s plan? What if they elected to go uninsured and pay the individual mandate tax? The following examples (see Figure 14.156) illustrate:
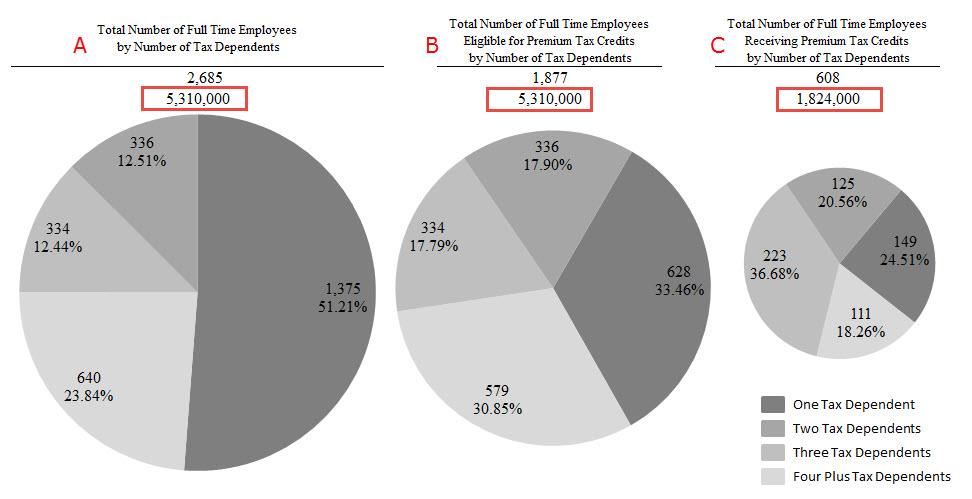
- The employer elects not to offer the minimum essential coverage. It has 2,685 full‐time employees and its calculated penalty is $5,310,000 (2,685 – 30 = 2,655 x $2,000). This represents the employer’s maximum liability and is referred to as the 4980H(a) penalty.
- The employer elects to offer an employer‐sponsored group plan. This meets the requirement to offer minimum essential coverage, but the plan itself does not meet the minimum 60% actuarial value requirement. In addition, of the 2,685 full‐time employees it is determined that 1,877 could be eligible for some kind of premium tax credit based solely on the salary from the employer and comparing it to the range of 100% to 400% of the federal poverty level tables (see Figure 14.155). If we assume in this example that all premium tax credit–eligible full‐time employees were certified as recipients of a premium tax credit, this would mean the employer would be liable for a $3,000 assessable payment per person and is referred to as the 4980H(b) penalty. This penalty would calculate to $5,631,000 (1,877 x $3,000), but the law caps this liability to not exceed the 4980H(a) amount which, in this example, is $5,310,000.
- Let’s further assume that the employer has made an estimate that of the 1,877 premium tax credit–eligible employees, a certain percentage goes to the state‐based, state‐partnership, federally‐facilitated or federally‐supported marketplaces and realizes the premium tax credit, another percentage gets covered under their spouse’s plan, another percentage remains uninsured and pays the individual mandate penalty, and the largest percentage actually represents dual‐income households whose modified adjusted gross income will make them
ineligible for the premium tax credits. This estimate would leave the total number of certified premium tax credit–eligible full‐time employees at 608. The result of this estimate would be a 4980H(b) liability calculation of $1,824,000 (608 x $3,000).
However, all three examples are based on estimates. The first example represents the maximum liability and the third example, a single‐point estimate for one calculated guess. This is where using Monte Carlo risk simulation adds value in getting a better view of the possibilities. The chart in Figure 14.157 is a histogram of a probability distribution of possible outcomes based on a set of input assumptions for this option (i.e., for each tier of coverage whether none, an educated guess, or all would receive a premium tax credit).
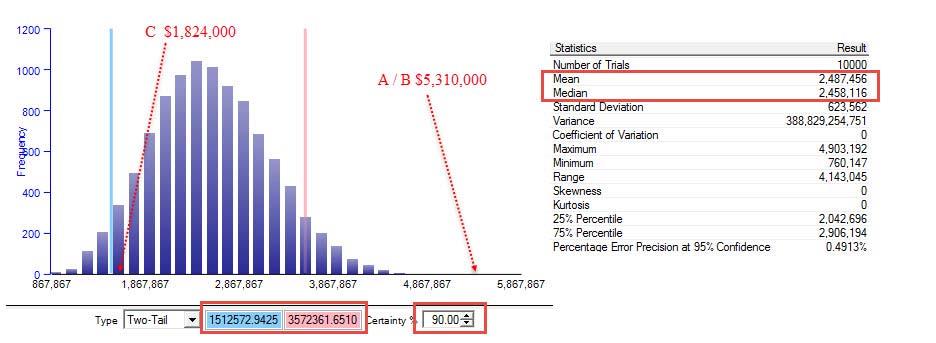
The Monte Carlo risk simulation uses 10,000 trials and exhibits a 90% confidence interval that the expected penalty range is between $1.5M and $3.6M with a mean of $2.5M. This example illustrates the potential to save an additional $2.8M ($5.3M − $2.5M) on top of the $8,700,000 if the employer offers coverage and creates a design strategy with some level of risk assumption that may or may not be of interest to the employer. What is important to note from this exercise is that the identification, quantification, and simulation of the option allows the employer to know what can be done, have an opportunity to review it, and accept it or veto it.
In parallel, the employer reviews each additional option with its special considerations as well and models its current arrangement to see what has happened in the past, what is expected to happen in the future, and some of the considerations in the analysis. Figures 14.158 through 14.164 are examples of considerations in this parallel process.
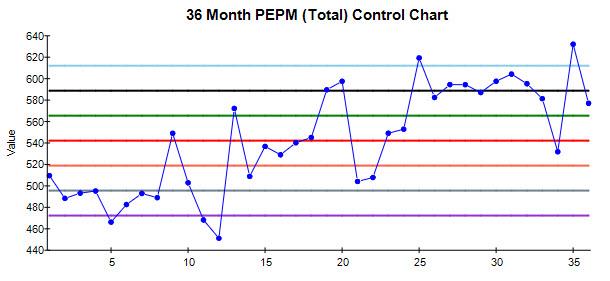
Figure 14.158 is a 36‐month control chart that calculates the per capita cost of the total healthcare cost on a per‐employee per‐month (PEPM) basis.

Figure 14.159 is a 36‐month control chart that calculates the per capita cost of the total healthcare cost on a per‐member per‐month (PMPM) basis.

Figure 16.160 is an example of a forecast for future healthcare costs using historical data and forecasting expected medical claims liability on per‐employee per‐month per‐capita basis.

Figure 14.161 is an example of the monthly aggregate dollar forecast of the medical claims liability for future healthcare costs using historical data.

Figure 14.162 is an example of comparing eight plan options and their respective per‐capita cost on per‐employee per‐year basis using demographic data and cost factors for each option.
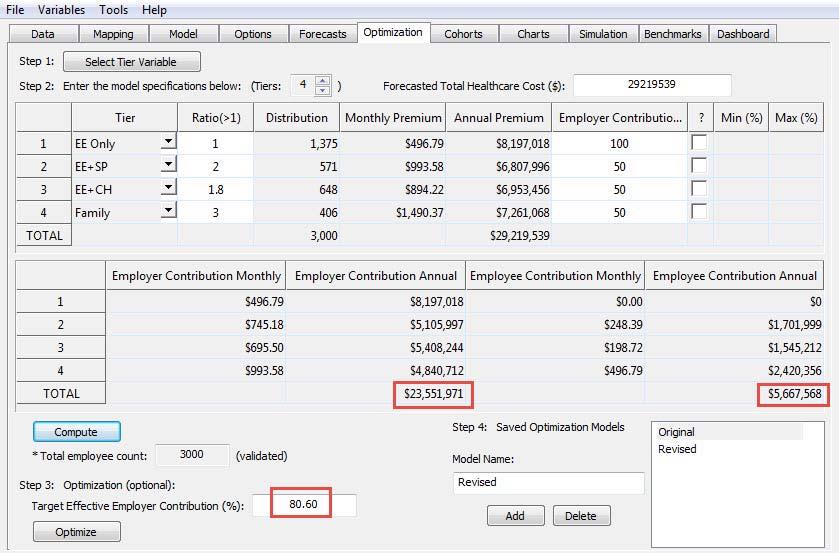
Figure 14.163 is an example of the current employer contribution structure (i.e., 100% for employee and 50% for all other tiers of coverage) and the net cost of coverage to the employer of $23.6M, which is 80.6% of the total cost of coverage.

Figure 14.164 is an example of a revised employer contribution structure where the target is set at 78% of coverage, which allows for the adjustment of whatever tiers of coverage are selected. In this case the employer contributes $22.8M at 78% of the total cost, which represents a reduction of $760,000 from its current cost of coverage.
Conclusion
This business case is intended as an overview of how the modeling of risk is valuable in the field of employee benefits. There is so much more to each of the options as each has its own special considerations, but by focusing on one and comparing it the employer’s current arrangement, we trust the point has been sufficiently made about how important this process is in providing insight into very costly decisions.

Recent Comments