Performing Due Diligence, Part 1
- By Admin
- December 1, 2014
- Comments Off on Performing Due Diligence, Part 1
Power tools such as Risk Simulator and Real Options SLS took years to build and many more years to be perfected. It is extremely likely that a new user can simply pick up software products such as these and hit the ground running immediately. However, some knowledge of the theory is required because, despite their analytical power, these software tools are just tools. They do not replace the analyst in any way. In fact, tools such as these only accouter the analyst with the appropriate analytics by, for example, relieving the analyst from the need to be proficient with fancy mathematics in order to build sophisticated models. In short, to create and perform sophisticated modeling, the analyst first needs to understand some of the underlying assumptions and approaches used in these analytics. Another consideration is that such tools do not themselves make decisions. It has been said that 50% of the challenge in decision making is simply thinking about the problem, 25% is the actual modeling and analytics, and the remaining 25% is convincing and explaining the results to senior management, clients, colleagues, and yourself. These tools provide simple graphical methods to broach difficult analytical subjects to management while freeing the analysts’ time to focus on the bulk of the value of a decision-making process: thinking about the problem.
Management’s Due Diligence
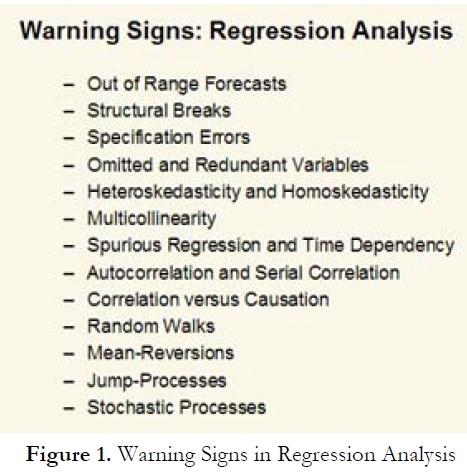
It might be the job of the analyst to create the models and use the fancy analytics, but it is senior management’s job to challenge the assumptions and results obtained from said analysis. For instance, Figure 1 lists some of the issues that may arise when running a multivariate regression analysis and time-series forecasting. Although it may not be senior management’s job to understand the mathematical or theoretical implications of these issues,
management must nonetheless have a good grasp of what they mean. The following sections, progressing from the general to the specific, are written specifically for senior management who are recipients of different types of advanced analyses results.
Sins of an Analyst
In general, warning signs can be grouped into five categories: model errors, assumption and input errors, user errors, analytical errors, and interpretation errors.
Model errors are the errors an analyst would make while creating models. For instance, a financial model created in Excel may have errors stemming from broken links, incorrect functions and equations, poor modeling practices, or a break in the knowledge transfer between the originator of the model and subsequent users as well as successors of the model. These errors can be eliminated through diligence on the part of the model creator. Good model-building practices also can assist in eliminating messy models. These practices include:
subparts that exist in the model.
accidentally breaking the model.
Assumption and input errors are more difficult to tackle. These errors include the inputs required to make the model compute; for example, items such as levels of competitive threats, levels of technological success, revenue projections, income growth rates, market share determination, and so forth. Many of these determinant factors are almost impossible to identify. In fact, the old adage of garbage in, garbage out holds true here. Multiple approaches exist to help clean up these so-called garbage assumptions. One way is simply to use expert knowledge and advice. For instance, the Delphi method requires the presence of a group of expert engineers in a room to discuss the levels of technological success rates. These engineers with intimate knowledge of the potential success rates are able to provide valuable insights that would otherwise be unavailable to a financial analyst sitting in front of a computer, far removed from the everyday technological challenges. A double-blind experiment also can be conducted, where experts in a group are asked on anonymous questionnaires what their objective estimates of an outcome are. These quantitative outcomes are then tabulated and, on occasion, more experienced participants’ comments will be weighted more heavily.
The expected value is then used in the model. Here, Monte Carlo simulation can be applied on the distribution of the outcomes related to these expert testimonies. A custom distribution can be constructed using Risk Simulator, which relates back to the weights given to each outcome, or a simple nonparametric custom distribution simulation can also be applied on all possible outcomes obtained. Obviously, if there are ample historical data, then it is relatively easier to project the future, whether it is using some time-series forecast, regression analysis, or Monte Carlo simulation. When in doubt, simulate! Instead of relying on a particular single-point input value of a particular variable, an analyst can just simulate it around the potential outcomes of that input, whether it is the worst-case scenario, nominal-case scenario, or best-case scenario using a triangular distribution or some other distribution through expert assumptions.
No matter the approach used to obtain the data, management must test and challenge these assumptions. One way is to create tornado and sensitivity charts. The variables that drive the bottom line the most (the variable of interest, e.g., net present value, net income, return on investment) that are unpredictable and subject to uncertain levels of fluctuations are the critical success factors that management should care about and focus on.
The bottom line is that the more expert knowledge and historical data that exist, the better the assumption estimates will be. A good test of the assumptions used is through the application of backcasting, as opposed to forecasting, which looks forward into the future. Backcasting uses historical data to test the validity of the assumptions. One approach is to take the historical data, fit them to a distribution using Risk Simulator’s distributional-fitting routines, and test the assumption input. Observe where the assumption value falls within this historical distribution. If it falls outside of the distribution’s normal set of parameters (e.g., 95% or 99% confidence intervals), then the analyst should be able to better describe why there will be a potential structural shift going forward (e.g., mergers and acquisition, divestiture, reallocation of resources, economic downturn, entry of formidable competition, and so forth). In forecasting, similar approaches can be used such as historical data-fitting of the forecast model and holdout approaches (i.e., some historical data are left out in the original forecast model but are used in the subsequent forecast-fitting to verify the model’s accuracy).
TO BE CONTINUED IN “Performing Due Diligence, Part 2”

Recent Comments