The Pitfalls of Forecasting, Part 1
- By Admin
- August 27, 2014
- Comments Off on The Pitfalls of Forecasting, Part 1
Regression Assumptions
The following six assumptions are the requirements for a regression analysis to work:
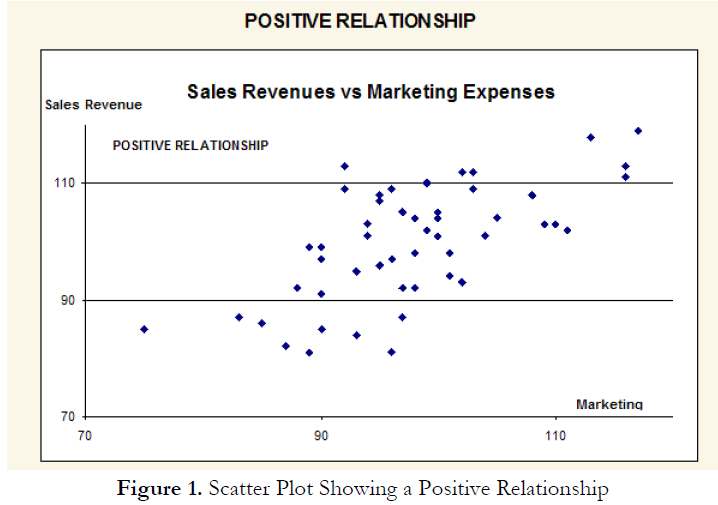
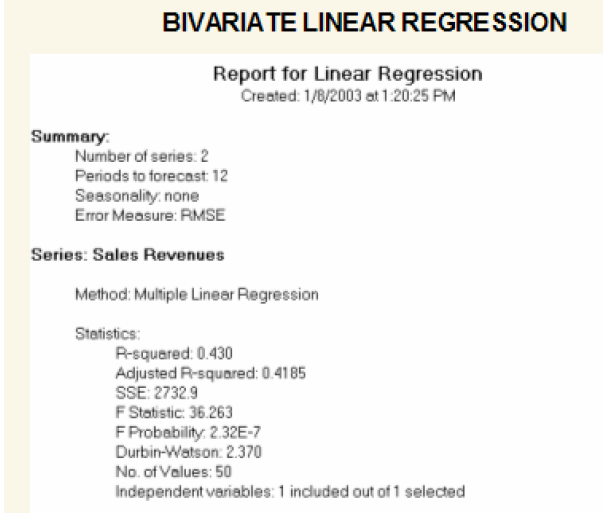
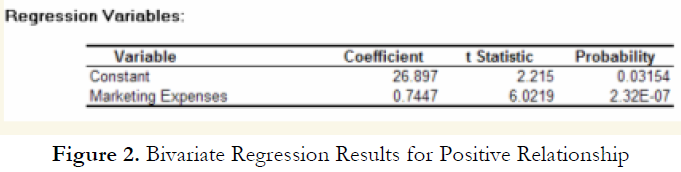
One easy method to verify some of these assumptions is to use a scatter plot. This approach is simple to use in a bivariate regression scenario. If the assumption of the linear model is valid, the plot of the observed dependent variable values against the independent variable values should suggest a linear band across the graph with no obvious departures from linearity, or no non-linearity. Outliers may appear as anomalous points in the graph, often in the upper right-hand or lower left-hand corner of the graph. However, a point may be an outlier in either an independent or dependent variable without necessarily being far from the general trend of the data. If the linear model is not correct, the shape of the general trend of the X-Y plot may suggest the appropriate function to fit (e.g., a polynomial, exponential, or logistic function). Alternatively, the plot may suggest a reasonable transformation to apply. For example, if the X-Y plot arcs from lower left to upper right so that data points either very low or very high in the independent variable lie below the straight line suggested by the data, while the middle data points of the independent variable lie on or above that straight line, taking square roots or logarithms of the independent variable values may promote linearity. If the assumption of equal variances, or homoskedasticity, for the dependent variable is correct, the plot of the observed dependent variable values against the independent variable should suggest a band across the graph with roughly equal vertical width for all values of the independent variable. That is, the shape of the graph should suggest a tilted cigar and not a wedge or a megaphone. A fan pattern like the profile of a megaphone, with a noticeable flare either to the right or to the left in the scatter plot suggests that the variance in the values increases in the direction where the fan pattern widens (usually as the sample mean increases), and this in turn suggests that a transformation of the dependent variable values may be needed. As an example, Figure 1 shows a scatter plot of two variables: sales revenue (dependent variable) and marketing costs (independent variable). Clearly, there is a positive relationship between the two variables, as is evident from the regression results in Figure 2, where the slope of the regression equation is a positive value (0.7447). The relationship is also statistically significant at 0.05 alpha and the coefficient of determination is 0.43, indicating a somewhat weak but statistically significant relationship. Compare the example illustrated by Figures 1 and 2 to a multiple linear regression shown in Figure 3, where another independent variable, pricing structure of the product, is added. The regression’s adjusted coefficient of determination (adjusted R-squared) is now 0.62, indicating a much stronger regression model. The pricing variable shows a negative relationship to the sales revenue, a very much expected result, as according to the law of demand in economics, a higher price point necessitates a lower quantity demanded and, hence, lower sales revenues. The t-statistics and corresponding probabilities (p-values) also indicate a statistically significant relationship.
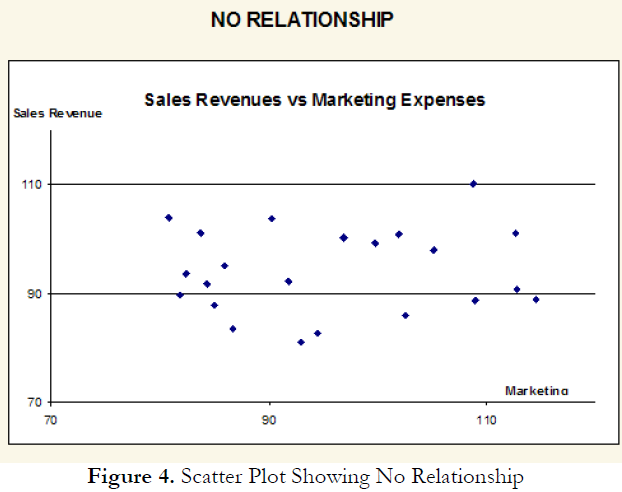
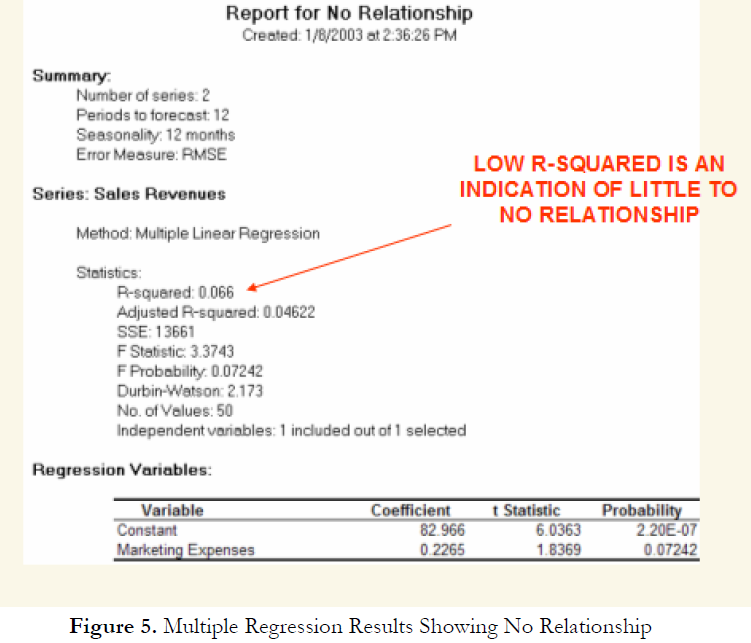
In contrast, Figure 4 shows a scatter plot of two variables with little to no relationship, which is confirmed by the regression result in Figure 5, where the coefficient of determination is 0.066, close to being negligible. In addition, the calculated t-statistic and corresponding probability indicate that the marketing-expenses variable is statistically insignificant at the 0.05 alpha level meaning that the regression equation is not significant (a fact that is also confirmed by the low F-statistic).
Forecasting is a balance between art and science. Using Risk Simulator can take care of the science, but it is almost impossible to take the art out of forecasting. In forecasting, experience and subject-matter expertise counts. One effective way to support this point is to look at some of the more common problems and violations of the required underlying assumptions of the data and forecast interpretation. Clearly there are many other technical issues, but the following list is sufficient to illustrate the pitfalls of forecasting and why sometimes the art (i.e., experience and expertise) is important:
Nonpredictability, and Stochastic Processes
(Brownian Motion, Mean-Reversion, Jump-Diffusion, Mixed Processes)
You’ll learn about these problems and more in subsequent issues of “The Pitfalls of Forecasting.”
TO BE CONTINUED IN “The Pitfalls of Forecasting, Part 2”

Recent Comments